Download
1 / 42
460 likes | 715 Vues
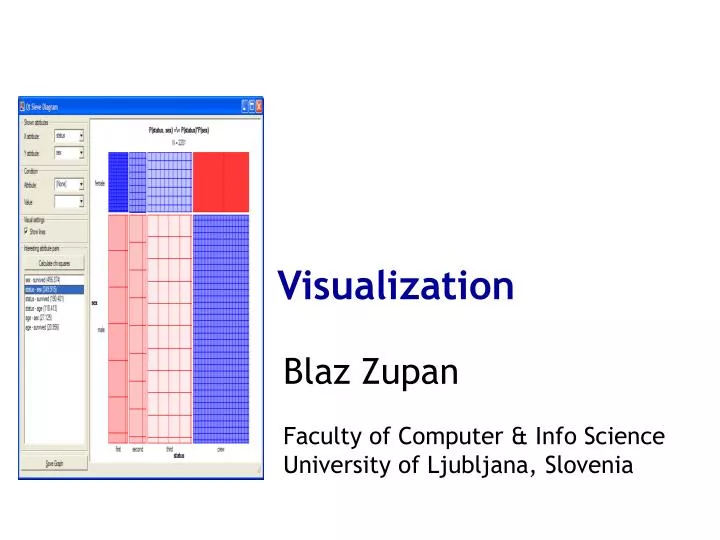
Visualization. Blaz Zupan Faculty of Computer & Info Science University of Ljubljana, Slovenia. Visual Data Mining. Basic idea visual presentation of the data gain insight & generate hypothesis draw conclusions directly interact with data Include human in the data exploration process

E N D
Visualization Blaz Zupan Faculty of Computer & Info Science University of Ljubljana, Slovenia
Visual Data Mining • Basic idea • visual presentation of the data • gain insight & generate hypothesis • draw conclusions • directly interact with data • Include human in the data exploration process • use her/his flexibility • creativity • general knowledge
Benefits of Visualization • involvement of the user • results are intuitive • no need for understanding complex mathematical or statistical algorithms or parameters • provision of qualitative overview of the data • can isolate specific patterns for further quantitative analysis • can deal with non-homogenous, noisy data
Visual Exploration Paradigm Overview first, zoom & filter, and then details on demand.
Visual Exploration Paradigm Overview first, zoom & filter, and then details on demand.
Classification Data Type other (e.g. algorithms/software, ...) from D Keim & M Ward: Visualization, in Intelligent Data Analysis, M Berthold & DJ Hand (eds), Springer, 2003. networks text, web content multi-dimensional two-dimensional one-dimensional Standard 2D/3D Display Standard Projection Geometrically Transformed Display Filtering Iconic Display Link & Brush Dense Pixel Display Distortion Stacked Display Zoom Visualization Technique Interaction & Distortion Technique
Data: One-Dimensional R Bellazzi: Mining Biomedical Time Series by Combining Structural Analysis and Temporal Abstractions, In Proc. of AMIA 1998.
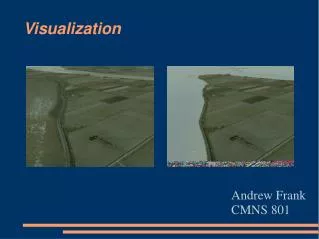
Data: Two-Dimensional MineSet’s Map Visualizer.
Data: Text • Galaxies visualization • Uses the “night sky” visualization to represent a set of documents • One document – one star • Stars clustered together represent related documents • Includes analytical tools to investigate groups and time-based trends, query contents From Inspire (TM) Software, see www.pnl.gov/infoviz/technologies.html
Data: Text • ThemeView (TM) • Topics or themes of text documents shown in relief map of a natural terrain • The height of a peek relates to the strength of the topic From Inspire (TM) Software, see www.pnl.gov/infoviz/technologies.html
Data: Text • Theme River (TM) • Identification of time related trends and patterns • Themes represented as colored streams • The width of the stream relates to the collective strength of a theme From Inspire (TM) Software, see www.pnl.gov/infoviz/technologies.html
Data: Networks S. cerevisiae gene interaction network Tong et al., Science 303, 6 Feb 2004. E. coli metabolic network (colors denote predominant biochemical class of metabolites) Ravasz et al., Science 297, 30 Aug 2002. V Batagelj, A Mrvar: Pajek @ vlado.fmf.uni-lj.si/pub/networks/pajek/
Data: Tree Hierarchies Unix home directory Selected detail Kleiberg et al.: Botanic Visualization of Huge Hierarchies, In InfoVis, 2001.
Classification Data Type other (e.g. algorithms/software, ...) networks text, web content multi-dimensional two-dimensional one-dimensional Standard 2D/3D Display Standard Projection Geometrically Transformed Display Filtering Iconic Display Link & Brush Dense Pixel Display Distortion Stacked Display Zoom Visualization Technique Interaction & Distortion Technique
Standard 2D/3D • x-y (x-y-z) plots • bar charts • line graphs • histograms • maps
Standard 2D/3D • x-y (x-y-z) plots • bar charts • line graphs • histograms • maps
Standard 2D/3D • x-y (x-y-z) plots • bar charts • line graphs • histograms • maps
Geom.-Transformed Displays • includes several classes of visualizations • projection pursuit, finding “interesting transformations” of multi-dim data set • scatterplot matrix • parallel coordinates
Iconic Displays W Horn et al.: Metaphor graphics to visualize ICU data over time, In IDAMAP 1998.
Dense Pixel Displays DA Keim et al.: Recursive Pattern: A technique for visualizing very large amounts of data Proc. Visualization 95, pages 279-286, 1995.
Dense Pixel Displays Ankerst et al.: Circle Segments: A technique for visually exploring large multidimensional data sets. In Proc. Visualization 96, Hot Topic Session, 1996.
Stacked Displays • an example is dimensional stacking • embed one coordinate system within the other • e.g. two attributes in one system, then another two when drilling down J LeBlanc et al.: Exploring n-dimensional databases. In Proc. Visualization 90, pages 230-239, 1990.
Stacked Displays Decision table visualization from SGI’s MineSet
Stacked Displays Mosaic display in Orange.
Classification Data Type other (e.g. algorithms/software, ...) networks text, web content multi-dimensional two-dimensional one-dimensional Standard 2D/3D Display Standard Dynamic Projection Geometrically Transformed Display Filtering Iconic Display Link & Brush Dense Pixel Display Distortion Stacked Display Zoom Visualization Technique Interaction & Distortion Technique
Dynamic projection dynamically change the projections to explore multi-dimensional data sets projection pursuit, which finds well-separated clusters in scatterplot Interactive Filtering browsing, can be difficult for big data sets querying, need to specify a subset Zooming Distortion e.g., fisheye view Brushing and linking requires well-integrated system for visualization selection from one visualization is fed into another one, selected instances highlighted in some way Interaction Techniques
Distortion GW Furnas: Generalized Fisheye Views, Human Factors in Computing Systems CHI ‘86 Conference Proceedings, 16-23. 1986.
Distortion From M Grobelnik, P Krese, D Mladenic: Project Intelligence (http://pi.ijs.si)
Distortion From M Grobelnik, P Krese, D Mladenic: Project Intelligence (http://pi.ijs.si)
Distortion From M Grobelnik, P Krese, D Mladenic: Project Intelligence (http://pi.ijs.si)
Integration ofVisualization & Data Mining • Visualization techniques can be applied before (or independently) of DM • DM can be used to find patterns (or data subsets) that are further visualized • DM is interactive, users use visualization to guide the pattern search • Visualization of data mining models
Regression Tree Regression tree visualization in SGI’s MineSet.
Classification Tree Classification tree visualization in Orange.
Intelligent Data Visualization • Use an established visualization technique, but search for • interesting subset of attributes • interesting subset of data instances • interesting projection (how to use selected attributes in visualization) • All these to find “interesting” visualization • Removes the burden for the user to find such visualizations by hand
Arrangement for Circle Segments M Ankerst: Visual data mining with pixel-oriented techniques, In Proc. KDD, 2001.
Conclusion • Clarity of presentation • Aesthetics • Navigation & Interaction • In data with many dimensions, tools are needed to find only “interesting” visualizations