Download
1 / 37
370 likes | 455 Vues
Quality data, sound judgements, powerful learning. Sara Glover – Executive Director, Portfolio Coordination Stephen Fraser – Data, Outcomes and Evaluation Office for Children and Portfolio Coordination 2010 NMR Conference Mantra Erskine Beach Resort, Lorne, May 31 st – June 1 st 2010.

E N D
Quality data, sound judgements,powerful learning. Sara Glover – Executive Director, Portfolio Coordination Stephen Fraser – Data, Outcomes and Evaluation Office for Children and Portfolio Coordination 2010 NMR Conference Mantra Erskine Beach Resort, Lorne, May 31st – June 1st 2010
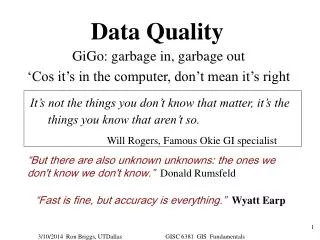
The essence of accountability is looking forward, using data to inform judgments about current performance and formulate plans for reasonable actions. (Earl and Katz, 2006)
Outline of the institute • Working with data • Building a data story • Break • Building a data story contd. • Leading change – a process to construct change theories • Engaging stakeholders • Monitoring impact
A framework for thinking and action Knowledge sharing and capacity building
School Performance Summary School Level Report Percentile/SFO Report VCE Data Service (online by VCAA) NAPLAN Data Service (online by VCAA) Attitudes to School Staff Opinion Parent Opinion
Working with data • Build data literacy across your school – data managers, data teams • You are not your data. • Data is half the story; context is the other half. • Look for the main stories. Don’t get bogged down in the detail and miss the main stories. • Don’t react to any one particular data set, for any one particular year. Always look at a range of data sets over time. Look for a consistent story. • Beware of small numbers (e.g. in small schools). Use the raw data (number of students) or aggregate statistics (e.g. over several years).
Interpretation Advice (… continued) • Absolute scores (usually shown as vertical blue columns, e.g., mean, % “C”) are useful for; • knowing how you compare to some standard (e.g. the VELS), • monitoring over time (i.e. are the scores increasing, declining or showing no clear pattern) and • specifying targets. • Percentiles (usually shown as horizontal orange bars) are useful for; • comparing your own performance to other schools, and • identifying strengths and weaknesses.
100th percentile 90th percentile 50th percentile 10th percentile 0th percentile Always remember how the data are constructed
Targeting low-SES students vs Targeting low performing studentsSource: Masters (2009) using PISA data
A comparison of NAPLAN scores for low SES students and all students
Leading change: using data to engage people in the change process • Build a data story • Develop a focus • Dig into the detail • Examine practice – what are we doing now – how do we know if it’s working? • Develop a change theory – what would happen if we did things differently? • Engage stakeholders • Do the work • Monitor impact
Kindergarten Participation in our community Early Childhood Community Profile Kindergarten Participation rate for 4 year olds across the LGA: 91% • Less than the metropolitan average • Less than the rural average
Children’s development across our community (AEDI) Developmental Vulnerability • Physical Health and Wellbeing: 9% • Social Competence: 10% • Emotional Maturity: 8% • Language and Cognitive: 13% • Communication and General Knowledge: 24%
Early Years Reading English Online Interview • High proportions of students in the lower bands Assessment of Reading Prep – Year 2 • - declining Prep outcomes (improving towards Year 2)
Reading Prep to Year 6 - VELS • Mismatch with EOI and with AoR • Greater distribution of outcomes towards Year 6 – more at the top, more at the tail
Reading Prep to Year 6 - NAPLAN • Improvement over the last two years • Greater distribution of outcomes towards Year 6 – more at the top, more at the tail (consistent with VELS)
Reading Year 7 to 10 - VELS • Decline over three year period • Greater distribution of outcomes towards Year 10 – more at the top, more at the tail (consistent with Prep to Year 6)
Numeracy Year 7 to 10 - VELS • Mixed over three year period • Improvement at Year 10
Reading Year 7 to 10 - NAPLAN • Improvement over last two years • Greater proportions of students in the lowest two bands by Year 10 (somewhat consistent with VELS) Year 7 Reading Year 9 Reading
Numeracy Year 7 to 10 - NAPLAN • Improvement over last two years • Stronger than Literacy • Lower proportions of students in the lowest two bands by Year 10 (somewhat consistent with VELS) Year 7 Numeracy Year 9 Numeracy
Post-Compulsory Outcomes - VCE • Decline in English • Increase in Maths (very strong) • Overall (allstudy) steady improvement
Post-Compulsory Outcomes - VET • High participation • High completion
Post-Compulsory Outcomes - VCAL • Low participation • High completion
Transitions and Pathways • Excellent and improving retention across the board 7-10 10-11 11-12 7-12
Transitions and Pathways • Overall – excellent proportions of students continuing with their education or training • Declining University enrolments.
Engagement and Wellbeing Strengths • Motivated students • Positive teacher-learner relationships Opportunities • Stimulating learning – high demand content – lacking • Safety an issue link with distress • Attendance excellent.
Climate Strengths • High Expectations • High motivation and goal alignment Opportunities • Collegiality and decision making
Building a data story • We have lower kinder participation rates • We have vulnerability in our community – language/general knowledge/communications • Literacy a challenge from the outset • We are seeing a decline in literacy outcomes at most transition points • Strong mathematics performance • We have very strong retention and pathways through to further education and training, with declining University enrolment. • We have engaged and motivated students – is the level of task challenge lacking? • We have motivated teachers with high expectations • Student and staff alike have a lack of say Outcomes Experiences
Dig into the detail • What can we learn about mathematics instruction in the Secondary years – about the students undertaking further maths in VCE • NAPLAN Data Service – Item Analysis Report (SREAMS SPA).
Examine practice – what are we doing now • What are our relationships with kindergartens like? • What are our transition arrangements/plans like? Are teachers getting the right information about literacy at the start of each year? • What level of involvement do teachers and students have in decisions that affect them?
Developing a change theory • Deciding what to do. • The most important, but often overlooked aspect of these theories is that they should be falsifiable – that is, they can be proven false. If we do …x , then we expect to see …y.
Monitoring progress…communicating successes and challenges against what we set out to do
Monitoring Impact • If the data doesn’t really capture what you’re trying to achieve in your school, target on the behaviours that will.
Engaging stakeholders – building ownership • Thinking about the traction achieved by engaging stakeholders vs going it alone • A question of how to harness the enthusiasm/effort/ownership of stakeholders at all levels • And what information/communication tools can be used to do so