Download
1 / 33
350 likes | 743 Vues
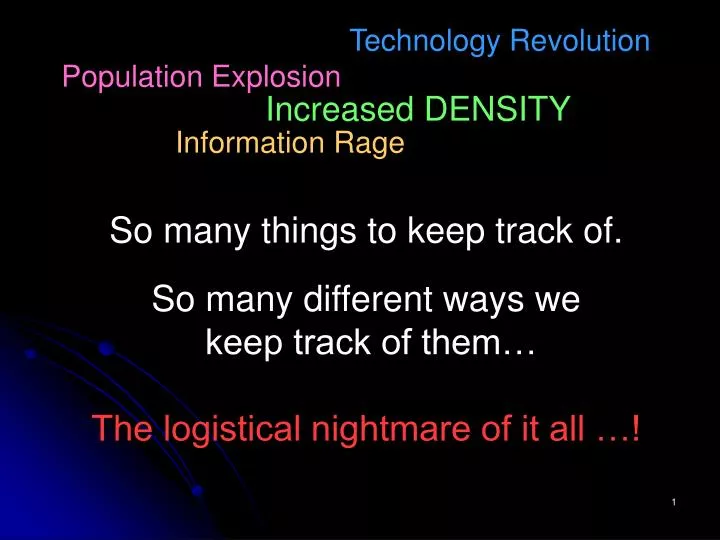
Technology Revolution. Population Explosion. Increased DENSITY. Information Rage. So many things to keep track of. So many different ways we keep track of them… The logistical nightmare of it all …!.

E N D
Technology Revolution Population Explosion Increased DENSITY Information Rage So many things to keep track of. So many different ways we keep track of them… The logistical nightmare of it all …!
The Log of LogsMathematics Student Portfolio By Robert N. BakerInstructor of MathematicsNew Mexico State University, Grantsemail- rnbaker@nmsu.eduPresented for AMATYC 2008 Washington, District of ColumbiaNovember 2008
Log of Logs : a portfolio designdata driven Funk and Wagnall’s defines“log” as a noun, a “record of the progress of an undertaking--usually technical in nature.” Like learning mathematics ! So, how do we record progress …?
From whence came this design? Laws of Nature Job experiences & modern employers Professional Standards: NCTM & AMATYC Outcome Standards: UAS & NM Higher Ed. indeed, through Accreditation processes My own attempts to adapt Standards and student needs into practice to enhance traditional learning, humanely.
Measure in dynamic systems • 1905 Einstein: time-space continuum Attempts to separate place from time have always distorted interpretations of reality, and always will. • 1927 Heisenberg: uncertainty theorems The more closely a measure informs us about position, the more it obfuscates trajectory, and vice versa. • 1931 Gödel: incompleteness theorems No set of axioms can fully explain a non-trivial system; there will always arise a truth that the system can not prove or predict.
By the 1930s, expanding American public school system adopted the INDUSTRIAL MODEL. Alarmed mathematics educators responded: George Polya: How to Solve It & Mathematical Discovery Richard Currant and Herbert Robbins: What is Mathematics? Mathematical problem solving in our dynamic world cannot be reduced to the static, discrete steps required by the assembly-line, mastery model. They were ignored.
Education is a dynamic system • 2004 & TIMMS suggests Polya and Courant were right. • AMATYC and NCTM Standards finally insist: Laws of the universe hold for people too! Educational needs of community college students DO depend on both time and place. “Traditional” pedagogy, its measures and assumptions no longer suffice.
How stuff works: Through ≈ 1970: Mechanical, sensory Could tinker and “figure it out” In 2008: Electronic, abstract, symbolic Must “read the instructions.” Reasonable sometimes. Reducible to algorithm often. Seldom sensible… The new “ Black Box” world is not accessible to the un-trained, to the un-equipped, the illiterate.
Employer Pressure:desired of degreed employees U. Alaska president’s informal study 2000 Read and explain technical information AMATYC and Georgia Transportation Dept 2001 Show up everyday Learn from mistakes
Incidental Evidence “Every day you got to keep logs” said a worker on a water-drilling rig with a road-building crew. (Overheard in Grants, NM on 26 June 2007. He provided example, shown here; a row for each “job,” in a 5-column table.)
Incidental Evidence, IIfrom Enchantment: The voice of New Mexico’s Rural Electric Cooperatives Oct. 2007 • Apprenticeship includes training in system terminologies, reading charts for rigging and equipment. “They learn to look at a line, understandwhy it is built the way it is, and recognize the … range designed for each type and calculate their minimum …” (shades of Polya!) • “Journeymen are gradually trained to do hot-line work. Meanwhile, they are busydocumenting daily activities.” The industry is changing pretty fast. With … devices and new loads coming online, you have to learn new stuff all the time.”
Crossroads CornerMarch 2007 AMATYC News “Why adopt mathematics standards?... • Increase quantitative literacy of all students • Develop students ability to communicate mathematically.”
“Math for All” The 10% talented in mathematics/logic, --assured by the normal curve, and --traditional targets of math-ed in schools, are no longer enough to meet modern society’s needs… -- the “other” 90% also need mathematics, for employment and consumption --and “algebra for all” diplomas and degrees
The Second TierSheila Tobias’ construct • Claim: Too many “good students” opt out of math and science as soon as possible. • Why? • The most significant contributing factors are the lacks of: • Opportunity to develop facility • with the language of the content • Opportunity to develop facility • with the “language” of human interaction • Shared success, the strength of spirit it engenders.
UAS Catalog“Student Outcome Goals: …Assignments and tasks will be embedded into the course objectives of many different courses at different level of the curricula to provide students the opportunity to learn and demonstrate mastery of these (6) competencies:Communication: …write, speak, read, and listen effectively for a variety of purposes…Quantitative Skills:…analytic and mathematical reasoning.. and quantitative problems…Information Literacy:…Identify…locate…analyze and evaluate…integrate and communicate…evaluate information, product and process.
UAS Catalog Cont. Computer Usage: …skills range from basic abilities, to telecommunications….and electronic mail technologies.Professional Behavior:…is expected of college students…including responsibility, good work habits, ethical decision making, ...and successful human relations.Critical Thinking :… approach from multiple perspective…compare and contrast ideas and models, and willingness to take intellectual risks.Students’ skills in these six areas will be assessed periodically during their studies at UAS”
Portfolios across the curriculum English faculty toutedportfolios for outcome assessment Not well-suited for technical studies: especially not the tradition Proposition: Adapt a great humanities tool for the hard sciences? Toward a goal: The Standards emphasize data … Log the data relevant to students: their grade, and process behind it.
Model for Grading Rubric for CCD and College Mathematics … Your gradefor this class will be determined by your performance across the four modes of assessment described below: Preparation and Participation ≥ 20% Tests and Quizzes ≤ 60% All tests are “open portfolio” Email writing or Other ≥ 10% Portfolio ≥ 10% *Note: Each component of this grading rubric is worth at least one full letter grade. *Note: This grade does not include a component for “student’s innate abilities.” Only student performance, as described herein, is considered in determining the final course grade.
Logs for the portfolio • Daily work, table with chronologic listing of • dates on which the class met, • all assignments given on each date, • check off attended class that day, or not • assessment scores from that day . • Weekly writing, table with chronologic listing of i) the main topic of each e-mail ESSAY submission, ii) date submitted, and iii) the grade received.
Student’s personal grade book * * * First experience with grade book for many education students, with Math as a tool for humans, by humans. • Experience with data and tables • Enables student self-grading • Back- up to instructor
Logs for the portfolio continued • Complete compilation of assessment problems i) all QUIZ and EXAM questions and problems, ii) with a correct solution supplied for each. • Table for “TOOLS of the TRADE”, with i) a listing of each tool’s name, ii) a description of the context for using the tool, iii) an example for its use. Mathematical tools include but are not limited to: symbols, formulas, algorithms, theorems, valuable facts, and contact information for each other.
Logs for the portfolio continued II • A listing of all VOCABULARY and abbreviations introduced in class and in the text. Definitions and examples ok, but not required. 6) A comprehensive technology log which i) gives the goal of each CALCULATOR USE ii) gives commands and chains-of-commands associated with each use. 7) A compilation including one EXAMPLE of independent work from each section of the text (and written self-assessments, as assigned).
Logs for the portfolio, other Service Learning Log: date, time, activity, supervisor initials applies also to Community Service, Internships, attendance and progress in self-paced settings, et al. Daily Activity Report Log: compiled in chronologic order applies to any lab setting requiring summary or report ? Differentiate symbols from tools and vocabulary? ? Other measures of progress?
Grading Sheet for Math 190 Portfolio, 1) Attend and participate format (4 column table) ______ complete _____ Accessible________ Score ________ 2) Q & E originals _______ corrections _____ Accessible________ Score ________ 3) Homework Samples labeled ____ difficulty _____ Accessible________ complete _______ Score ________ 4) Tools format (what, when, how) ____ complete _______ Accessible________ Score ________ 5) Technology format (use, commands) ____ complete _______ Accessible________ Score ________ 6) Vocabulary List complete _______ Accessible________ Score ________ 7) Overall Presentation Score _______/5 Total _________ ( out of 35 midterm, 95 final) Grading the portfolioa score sheet (see syllabus)
Reflection HW: post first exam 1. You recently took an “open portfolio” exam in this class. Answer the following questions regarding the usefulness of your portfolio as a tool for aiding your test-taking effort. Be specific, and please use complete sentences. i) How did you find your portfolio helpful in taking this exam? ii) Which of the logs in your portfolio did you access while you were taking this particular exam? What information did you seek in each? iii) Given the portfolio as assigned, could yours have been more useful than it was?_______ iv) What can you do to make your portfolio more useful for the next exam?
ARTIFACTEvidence in Context For student: Reference center, now and later Documentation to grease transfer credit Self-reflection and assessment device enables learning from mistakes For Instructor: Back up, refresher, and overview Concrete evidence of student involvement applied to critical thinking For Program: Concrete, compact, comprehensive, adaptable and not an add-on.
Log of Logs: a portfolio Focused on traditional mathematical content, students gain guided experience with: Job Skills--documentation Information and data literacy Manipulation of information formats Communications skills Critical thinking Professional behavior and Self-assessment …and good study habits
NMHED: L D G E Common Core Transfer…Competenies I was told: “This year we assess Standard One in both your Math210 and Stat251 classes: ‘Display, analyze and interpret data.’ The HED restates … ‘Students should: Discriminate among different types of data displays for the most effective presentation. LOG CONTENTS VARY b. Draw conclusions from the data presented. c. Analyze the implication of the conclusion to real life situations.’ SELF-GRADE WORKSHEET Please convince me that your plan addresses these specific competencies.”
NMHED: L D G E Common Core Transfer…Competenies II My response was already in place: the log of logs is driven by data relevant to students. for part a: “The portfolio consists of organizing both quantitative and qualitative data, discrete and continuous data. The qualitative data includes both categorical data (attended/not, for example) and judgment data (deciding which tools to include, for example). Different logs contain different types of data, and thus require different compile and display formats.”
NMHED: L D G E Common Core Transfer…Competenies II continued Alsoalready in place, “… students will interpret the data” for parts b &c: “Students are assigned to perform the self-grade evaluation several times each term. They use these results--obtained from information they have compiled in their own portfolios--as feedback on their own efforts, and adjust according to their desired learning outcomes... This is a very real situation for students, especially full-time students.”
Worksheet to guide self-grading In each realm you must compute the ratio of the number of points you obtained to the total number of points possible. (Your portfolio should contain all information needed to determine these ratios). Tests and Quizzes: Your total / Possible total as a Percentage: ______ Portfolio: Your total / Possible total as a Percentage: ______ Other graded: Your total / Possible total as a Percentage: ______ Prepare & Participate: Your total / Possible total as a Percentage: ______ Weighted average: Fill in the blanks and compute. Use above for your percentages; use syllabus to find the weight for each realm. (T&Q %age) • (T&Q weight) + (P %age) • (P weight) + (Oth %age) • (Oth weight) + (P&P %age) • (P&P weight) = course %age _____ • _____ + _____ • _____ + _____ • _____ + _____ • _____ = _______ + _______ + _______ + _______ = _________
Worksheet to guide self-grading continued Measuring Preparation & Participation approximately Number of course meetings ____ • 3 = ____ Points possible from graded daily work: _____ Sum = total possible for P & P = _______ Your total from graded daily work: ______ Number of classes you attended: _____ Number of classes you arrived prepared for: _____ Number of classes you asked questions during: _____ Sum = your total for P & P = __________ Percentage (your total / total possible): ________
Keeping track of diverse forms of informationunderlies the search for patterns, in quantitative and qualitative data. Mathematics includesIntrinsic Beauty AND Usefulness