Download
1 / 6
60 likes | 177 Vues
Submarine Eruptions in the NE Lau Basin W. Mata Actively Erupting NE Lau Spreading center Erupted within the year. V35 Submarine Volcanic Eruptions: Studies of Geological, Chemical, and Biological Processes. 8.0. 7.5 6.7 6.6. 7.3/5.4 nr. 7.0. 7.6. 8.4. Resing et al., 2009.

E N D
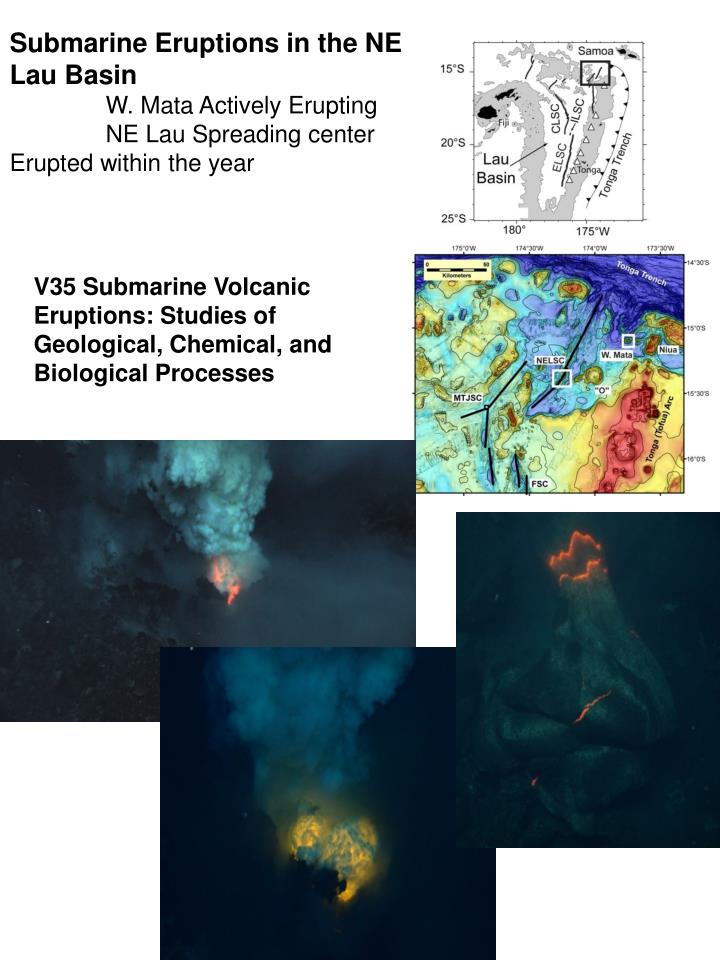
Submarine Eruptions in the NE Lau Basin W. Mata Actively Erupting NE Lau Spreading center Erupted within the year V35 Submarine Volcanic Eruptions: Studies of Geological, Chemical, and Biological Processes
8.0 7.5 6.7 6.6 7.3/5.4 nr 7.0 7.6 8.4 Resing et al., 2009.
Figure 2A. Bathymetric Maps of hydrothermally active volcanoes and vertical profiles of chemical anomalies above them. Tows are indicated by black lines on the maps with green and red circles indicating the starting and ending points of the tows respectively. Locations of vertical casts are indicated by yellow filled symbols. Note that scales are different for each volcano. Particulate aluminum and sulfur are designated by pAl and pS respectively. pS = Elemental sulfur (pSEl) +Non volatile sulfur (pSNV). Total Dissolvable Fe and Mn (TDFe and TDMn) are the total amount of Fe and Mn in an unfiltered acidified samples, while Dissolved Fe and Mn (DFe and DMn) are the amount of Fe and Mn in a filtered acidified sample. DpH and DCO2 are the changes in pH and CO2 from the regional background respectively.
Figure 3. Low level venting as identified by helium isotopic data. The solid line represents the background the *3He along the arc, however it is based on a single location at ~18ON in the study area (see Figure 1). Although this background is not fully representative of the background at different particular sites within the study area, its overall shape is. During individual casts, the *3He levels above and below the plumes are more representative of local background. Of the four casts taken around the summit of Ahyi Volcano, a single sample showed anomalously high the *3He . pH data indicate that this single sample was from this depth and not inadvertently collected at a deeper depth.
Figure 4. DpH and DCO2 are the changes in pH and ECO2 respectively from their regional backgrounds. The inset in the top panel shows that decreases in the pH of seawater result from the addition of CO2 and/or mineral acidity (H+). The addition of CO2 decreases pH and increases ECO2, while the addition of H+ decreases pH without increasing ECO2 . When only CO2 is added, the slope of DCO2 vs DpH is approximately 360µM/pH unit. When H+ is added along with CO2 the change in pH per CO2 increases (slope decreases). When carbonate alkalinity is added pH increases, however when both carbonate alkalinity and CO2 are added, pH decreases, but the decrease is less than that when only CO2 is added. These results were modeled using a seawater carbonate modeling program [Lewis and Wallace, 1998] and the lines are best fit results for the addition of the fluids indicated to ambient seawater.