Download
1 / 58
580 likes | 751 Vues
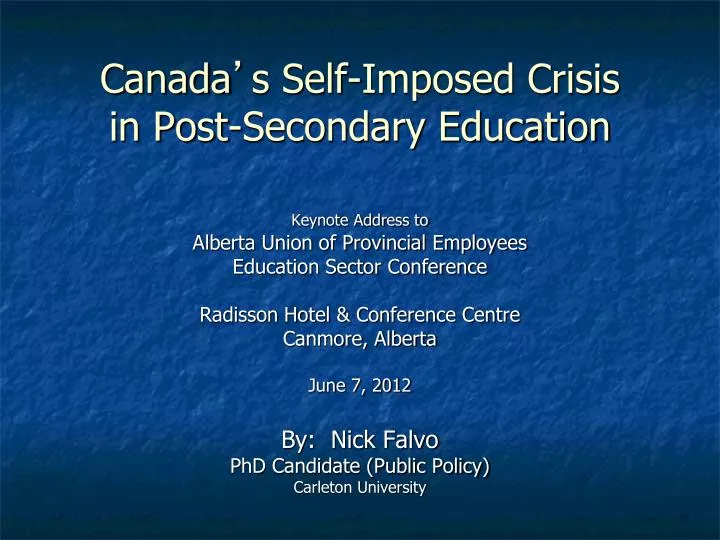
Canada ’ s Self-Imposed Crisis in Post-Secondary Education. Keynote Address to Alberta Union of Provincial Employees Education Sector Conference Radisson Hotel & Conference Centre Canmore, Alberta June 7, 2012 By: Nick Falvo PhD Candidate (Public Policy) Carleton University.

E N D
Canada’s Self-Imposed Crisis in Post-Secondary Education Keynote Address to Alberta Union of Provincial Employees Education Sector Conference Radisson Hotel & Conference Centre Canmore, Alberta June 7, 2012 By: Nick Falvo PhD Candidate (Public Policy) Carleton University
Overview of Presentation • Macroeconomic Context • PSE Indicators • Shouldn’t Students Pay Their Fair Share? • Household Debt • Quebec
Overview of Presentation (cont’d) • Newfoundland and Labrador • The Munk Effect • The Quest for Research Dollars • Concluding Thoughts
Tax Cuts Federal government takes in $48 billion less in tax revenue today than in 2000. →$12 billion of this represents the two -percentage-point cut to the GST brought in by Harper gov’t
How Big is $48 Billion? $3.5 B A universal, accessible child-care system for children aged 3-5. $10 B A complete national child care program, including early childhood education
How Big is $48 Billion? (cont’d) $4.4 B Remove tuition costs for all students currently enrolled in Canadian universities
Government Funding for Post-Secondary Education • 1979 Gov’t grants covered 80% of a university or college’s operating budget • 2012 Gov’t grants cover roughly 50% of a university or college’s operating budget
Average Tuition Fees for Full-Time Undergraduate University Students
Average Undergraduate Tuition for Full-Time Students NL $2,649 PEI $5,258 NS $5,731 NB $5,853 QC $2,519 ON $6,640 MB $3,645 SK $5,601 AB $5,662 BC $4,852 Canada $5,366
Average Graduate Tuition for Full-Time Students NL $2,456 PEI $3,992 NS $7,326 NB $5,258 QC $2,731 ON $7,578 MB $4,173 SK $3,504 AB $4,676 BC $7,303 Canada $5,599
But if Students are Going to Earn More, Should They Really Be Complaining?
Likewise, if they’re going to rarely find themselves unemployed…
But Remember: There’s Another Side to That Coin… Higher-income earners with steady employment also pay more taxes.
Key Findings from CCPA-BC Research “Over their working lives, women with an undergraduate degree contribute, on average, $106,000 more to the public treasury than women with only a high school diploma;”
Key Findings from CCPA-BC Research (cont’d) “Similarly, university-education men contribute $159,000 more to the public treasury than men with only a high school diploma;”
Key Findings from CCPA-BC Research (cont’d) “In contrast, a four-year undergraduate degree [in BC] costs $50,630, of which tuition fees make up 40 per cent.”
Class Sizes Getting Bigger • B/w 1990 and 2006, ratio of PSE students to full-time faculty members ↑d by 40%.
% of Canadian University Students Who Work During the Academic Year • 1976 25% • 2008 50% →75% of students believe this paid work has had a negative effect on their academic performance.
And Then There Was Quebec… • Among the lowest tuition fees in Canada • PSE participation in Quebec is 9% higher than in the rest of Canada
Comparing Student Debt Average of debt for students enrolled in their final year of a bachelor’s degree program who took out student loans is: • Quebec: $15,000 • Ontario: $26,000
Canada’s Best-Kept PSE Secret: Newfoundland and Labrador • Since 2003, N&L gov’t has ↑d funding for PSE by 82%. • Average tuition fees for domestic students in N&L are now $2,600/yr, which is half the Canadian average.
Newfoundland and Labrador (cont’d) • Enrolment in N&L’s only university and only community college by students from the other three Atlantic provinces ↑d more than tenfold between 2001 and 2008. • Since the late 1990s, # of people in N&L with student debt has ↓d from 20,000 to roughly 8,000.
The Munk Effect • Apr. ‘10 Announcement “$35 million from Peter Munk” for new school of global studies at U of T. “The Munk School of Global Affairs”
The Munk Effect (cont’d) • Located on Bloor Street West • Pixel board “flashing the latest world news headlines”
Munk Effect: Public Recognition • Front page news at Globe and Mail A “vision of a global plaza reconfiguring Toronto’s downtown Bloor Street West and becoming the hub of Canada’s conversation with the world.”
Munk Effect: Public Recognition (cont’d) “Whatever controversies may follow Munk abroad — his company has come under attach from environmental and indigenous groups, who’ve held annual demonstrations in Chile, Argentina, Peru, the Philippines, and Tanzania…Munk is associated with loftier things. His name is indelibly linked with good works…”— McQuaig and Brooks, 2011
Munk: Who Pays What? • Though Mr. Munk appears to pay $35 million, he in fact receives a tax reduction amounting to at least $16 million. • Ergo: his net contribution is a max. of $19 million.
Munk: Who Pays What? (cont’d) • Federal government and Ontario government have contributed an additional $25 million each.
Munk: Who Pays What? (cont’d) • In Summary: • Munk: $19 million • Canadian taxpayers: $66 million Ergo: Peter Munk pays 22% of announced contributions (not including ongoing operating costs)
Munk: Who Pays What (cont’d) • But there’s more… $15 million of Munk’s so-called “$35 million contribution” is held back until after 2017…
Munk: Who Pays What? (cont’d) • Agreement stipulates that School’s director must report annually to a board appointed by Munk to “discuss the programs, activities, and initiatives of the school in greater detail.”
Does This Impact Academic Freedom? “Is it likely, given Munk’s power to withhold funds, that this ‘School of Global Affairs’ will encourage academic inquire into, say, the activities of multinational companies in developing countries, where Munk’s Barrick Gold Corporation has come under heavy criticism?” — McQuaig and Brooks, 2011
Munk: In Sum • Munk provided a relatively small amount of money, and, in return, received a personal marketing boost. • U of T got a relatively small amount of money, and, in return, may have compromised academic freedom for its 80 faculty members.
Federal Funding Canada Social Transfer • Transfers funds to provinces • Few strings attached
CFS Recommendations • A Post-Secondary Education Act “modeled after the Canada Health Act.” • Five principles: 1) public administration; 2) comprehensiveness; 3) universality; 4) portability; and 5) accessibility.
Why Do Universities Want More Research Funding? • Prestige • Dollars beget dollars • Dollars attract faculty • All of the above attract students
The $100 Million Club 1. U. of Toronto 2. UBC3. U. de Montréal 4. U. of Alberta 5. McGill 6. McMaster 7. U. Laval 8. Calgary 9. U. of Ottawa 10. Western 11. Queen’s 12. Saskatchewan 13. U. of Manitoba 14. Guelph 15. Waterloo 16. Dalhousie
Research Funding 1. U. of Toronto 2. UBC 3. U de Montréal 4. U of Alberta 5. McGill 6. McMaster 7. Laval 8. U of Calgary 9. Ottawa 10. Western 35. Lethbridge
Research Intensity (i.e. research funding per full-time faculty) 1. INRS 2. U of Toronto 3. McMaster 4. U of Alberta 5. McGill 6. U de Montréal 7. Queen’s 8. UBC 9. Laval 10. Ottawa 12. Calgary 41. Lethbridge
Following the Money • “[I]t is a virtuous cycle whereby increased research funding leads to higher rankings leads to better students (higher GPAs) leads to more ambitious research faculty (less teaching), more research funding and so on...The problem is that for every virtuous cycle there are vicious cycles created for those universities less able to bring in research funding and [such universities] can quickly become stigmatized (2nd tier or even last chance U)…[These] cycles speed up the polarization until the top universities want to institutionalize their status (the big 5)...” — Dr. Christopher Stoney , Carleton University
The Big 5 Proposal • Play first 2:15 of this video clip: http://www.youtube.com/watch?v=QrACKpypyzo&feature=fvsr