Download
1 / 22
220 likes | 356 Vues
Climate Change impacts in East Africa: some recent model results. P.K. Thornton, R. Boone, R. Conant, J. Sircely , P. Ericksen. SI and CC Hub planning meeting Addis Ababa 28 to 30 January 2014. Interactions of climate change with sustainable intensification. Three issues:

E N D
Climate Change impacts in East Africa: some recent model results P.K. Thornton, R. Boone, R. Conant, J. Sircely, P. Ericksen SI and CC Hub planning meeting Addis Ababa 28 to 30 January 2014
Interactions of climate change with sustainable intensification Three issues: • Productivity increases can also increase GHG emissions • Climate change will alter precipitation and temperature, changing the production environment • Incentives to adopt “Climate Smart Agriculture” introduce new constraints and opportunities for farmers to consider
Data from 17 CMIP5 climate models in the CCAFS repository ccafs-climate.org
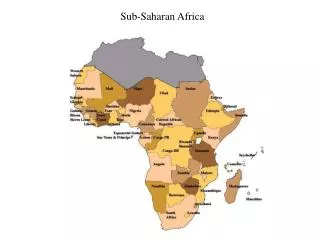
Mean daily temperature in sub-Saharan Africa to the 2090s Africa south of lat 18°N, all areas with LGP>40 days per year (grey mask below) Ensemble mean, 17 GCMs downscaled to 10 arc-minutes (about 18 km) For two emission scenarios, RCP 4.5 and RCP 8.5 Thornton & Jones (2014)
Mean length of growing period (LGP), days per year Thornton & Jones (2014) Baseline conditions, Year 2000 (WorldClim) Ensemble mean, 17 GMCs from CMIP5, 2050s, RCP8.5 (high GHG emissions scenario)
Percentage change in mean LGP and robustness of the results Thornton & Jones (2014) Change in LGP (%) in the 2050s compared with 2000, RCP8.5, ensemble mean results (17 GMCs) Coefficient of variation of the estimate of % LGP change to the 2050s
Percentage change in mean LGP and robustness of the results Thornton & Jones (2014) Perhaps longer growing seasons in parts of E Africa … … but high inter-model variability in the estimate Change in LGP (%) in the 2050s compared with 2000, RCP8.5, ensemble mean results (17 GMCs) Coefficient of variation of the estimate of % LGP change to the 2050s
Starting dekad (10-day period) of the major growing period Thornton & Jones (2014) Starting dekadfor current conditions (2000) Mean starting dekad, 17 GMCs from CMIP5, 2050s, RCP8.5 (high GHG emissions scenario)
Mean change in dekad (10-day period) of start of the major growing season to the 2050s Thornton & Jones (2014) Change in starting dekad of major season from to 2050s, RCP8.5, ensemble mean results (17 GMCs) Coefficient of variation of the estimate of change in season start to the 2050s
Mean change in dekad (10-day period) of start of the major growing season to the 2050s Thornton & Jones (2014) A confused picture regarding season start dates in parts of E Africa … … coinciding with high inter-model variability and low robustness Change in starting dekad of major season from to 2050s, RCP8.5, ensemble mean results (17 GMCs) Coefficient of variation of the estimate of change in season start to the 2050s
What do these results mean for food production in eastern Africa? • Apparently not much difference in climate projections between the climate models of CMIP3 (AR4 in 2007) and those of CMIP5 (AR5 in 2014) • A +4°C for SSA arrives by the 2080s, on a high GHG emissions trajectory (RCP 8.5). NB this is the pathway we are currently on(+5°C by 2100) • Situation for cropping a cause of considerable concern, on current emission trajectories: • Most parts of the region will undergo contraction of growing periods (a robust result, independent of climate model used) • Limited parts of the highlands may see expansion of growing periods (not such a robust result: it depends on the climate model used)
What do these results mean for food production in eastern Africa? • Crop yield simulations are being run now, but results are likely to be similar to simulations run with CMIP3 climate models: overall decreases in crop yields to the 2030s and 2050s, which are severe in some places. • Shifts in season start dates also likely, in addition to shifts in length of growing periods (results so far are confused, and need more work) • Increases in extreme events and in climate variability are very likely, with direct impacts on livelihoods and food security • “Business-as-usual” emission scenarios globally are not an option: we already know that +4°C for African agriculture would be catastrophic for large parts of the continent • Huge effort needed to roll out and support risk management and longer-term adaptation actions that are climate-smart
Prior to creating G-Range, we judged existing models to be: Too complex … Grass = Grass + Grass * 0.1 … too simple … Run 5 Run 6 Run 4 Run 7 Run 3 Run 8 Run 2 Run 9 … a challenge to use … Run 1 Run 10 Run 20 Run 11 Run 19 Run 12 Run 18 Run 13 Run 17 Run 14 Run 16 Run 15 … or “abandonware”
We created G-Range • Represent global rangelands • Respond to main climate variables • Represent main functional biomass groups • Responsive to fire, grazing intensity, and other management practices • Randy Boone, Rich Conant, Jason Sircely • With support from:
Preliminary G-Range Results Annual Net Primary Productivity 1997 – 2006 2050 – 2059 (Met. Office, Hadley Centre, RCP 45)
Preliminary G-Range Results Shrub Cover 1997 – 2006 2050 – 2059 (Met. Office, Hadley Centre, RCP 45)
Preliminary G-Range Results Herbaceous Cover 1997 – 2006 2050 – 2059 (Met. Office, Hadley Centre, RCP 45)
Climate smart agriculture research priorities • Climate smart combines adaptation plus mitigation, AND food security • Context of rapidly changing production systems and livelihood strategies • Constraints on social/ econ/ institutional issues of adaptive capacity • SCENARIOS as a planning tool
Regional integration Proactive governance Reactive governance Fragmented status quo
GDP • Population • Yields • Calorie availability • Infrastructure • Production systems • Land cover • Emissions Results across scenarios
Mitigation potential of some options (Thornton and Herrero 2010 PNAS)
CSA research (2) • Technical interventions both new and old • Water management • Rangeland productivity and change • Breeds: ??? • Feeds!! • Diseases: different transmission pathways