Download
1 / 17
170 likes | 338 Vues
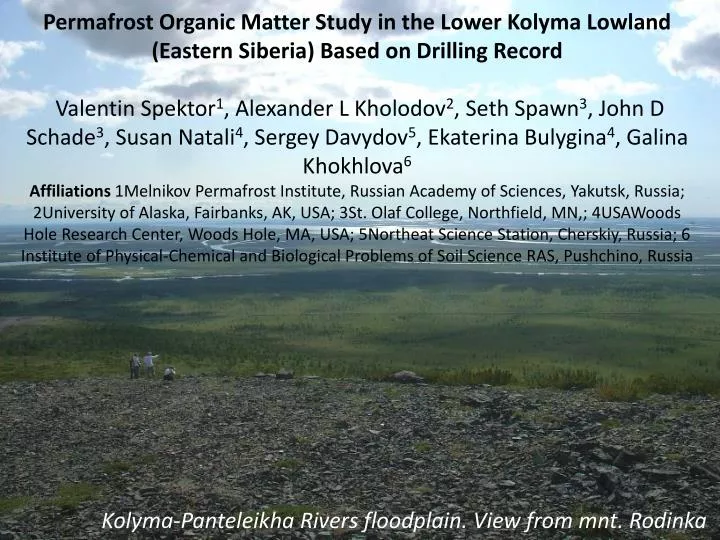
Permafrost Organic Matter Study in the Lower Kolyma Lowland (Eastern Siberia) Based on Drilling Record Valentin Spektor 1 , Alexander L Kholodov 2 , Seth Spawn 3 , John D Schade 3 , Susan Natali 4 , Sergey Davydov 5 , Ekaterina Bulygina 4 , Galina Khokhlova 6

E N D
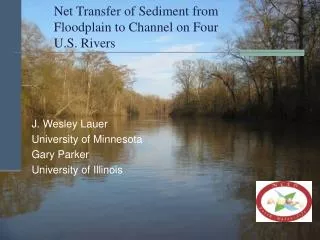
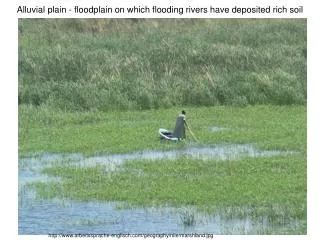
Permafrost Organic Matter Study in the Lower Kolyma Lowland (Eastern Siberia) Based on Drilling Record Valentin Spektor1, Alexander L Kholodov2, Seth Spawn3, John D Schade3, Susan Natali4, Sergey Davydov5, Ekaterina Bulygina4, Galina Khokhlova6 Affiliations 1Melnikov Permafrost Institute, Russian Academy of Sciences, Yakutsk, Russia; 2University of Alaska, Fairbanks, AK, USA; 3St. Olaf College, Northfield, MN,; 4USAWoods Hole Research Center, Woods Hole, MA, USA; 5Northeat Science Station, Cherskiy, Russia; 6 Institute of Physical-Chemical and Biological Problems of Soil Science RAS, Pushchino, Russia Kolyma-Panteleikha Rivers floodplain. View from mnt. Rodinka
43400 ± 800! 45400 ± 690! >43600! 46000 ± 7100! 44000 ± 840! 45200 ± 950! 42400 ± 700!
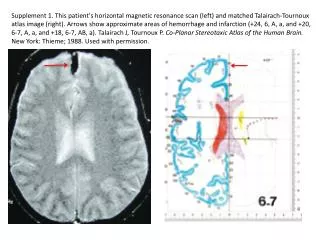
Unit 1 (12-13 m interval) was accumulated under stream channel conditions with active hydrological regime (strong current) Unit 2 (5 to 12 m interval) corresponds to the next stage of stream valley development of channel fluctuations. And changes of strong current to old channel lakes hydrological regime. Unit 3 (5 to 3 m interval) was formed under the old channel lake conditions Unit 4 (0 to 3 m) corresponds to transition from subaqual to subaeral conditions of modern floodplain with polygonal surface and modern ice wedges.
Borehole 12/2. Variations of main organic matter features vs depth C/N ratio dC13 Total N and C content, % Depth, m
Unit 1 (9 to 15 m interval) was formed under the conditions of dry grassy-shrub tundra-steep. At the end of this unit formation increasing of surface wetness and, probably, even local thermokarst process took place. The former indirectly confirmed by the ice rich horizon. Unit 2 (9 to 2 m interval) has a fluvial origin and was formed within the stream valley or wetland environment close to conditions of Units 2 and 3 of borehole 12/2 formation. Unit 3 (0 to 2 m interval) is a cover layer, which was thawed from the top during Holocene climatic optimum and, then refrozen due to climate cooling. Accumulation environment was close to recent.
Borehole 12/1. Variations of main organic matter features vs depth dC13 Total N and C content, % C/N ratio Depth, m
ENZIME ACTIVITIE Phenoloxidase (POX) - lignin b-glucocidase (BG) – carbon Phosphotase (PHOS) – phosphorous Leucene-aminopeptidase (LAP) - nitrogene
CONCLUSIONS 1. Organic matter content in the investigated deposits resulted in lost on ignition is in a range from 1.75 to 9.5%. 2. Mean TOC of deposits have been formed in relatively “dry” conditions is 0.79%, while in wetland or aquatic deposits it is 1.25%. 3. Conditions of sediments formation strongly impact on both total organic content in this permafrost strata and its quality. 4. Subaqual environment of sedimentation under shallow lakes or wetlands has a higher potential for carbon accumulation because of both autochthonic and allochthonic OM deposition. 5. Mean C/N ratio and dC13 values are in deposits had been formed in relatively dry conditions are 11.76 and -34.8‰ while in aquatic or wetland sediments 11.27 and -29.21‰. 6. Positive correlation with coefficient 0.67 between dC13and C/N ratio was determined. 7. Main portion of OM in permafrost represented by lignin.
ACKNOWLEDGEMENTS. The work is supported by “The Polaris” Project of National Science Foundation USA and Interactional Program #9 of the Siberian and Far East Branches of the Russian Academy of Sciences.