Download
1 / 10
100 likes | 301 Vues
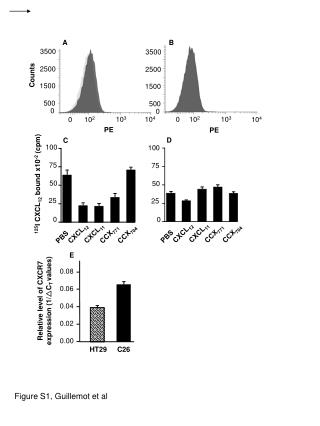
Supplemental Figure 1. A. B. 100. 100. 80. 80. 60. 60. Counts. Counts. 40. 40. 20. 20. 0. 0. TLR8-PE. TLR3-PE. C. 100. 80. 60. Counts. 40. 20. 0. TLR9-PE. Supplemental Figure 2. B. A. ***. **. 1.5. **. 50. **. 250. 40. 1. 200. No. of living cells

E N D
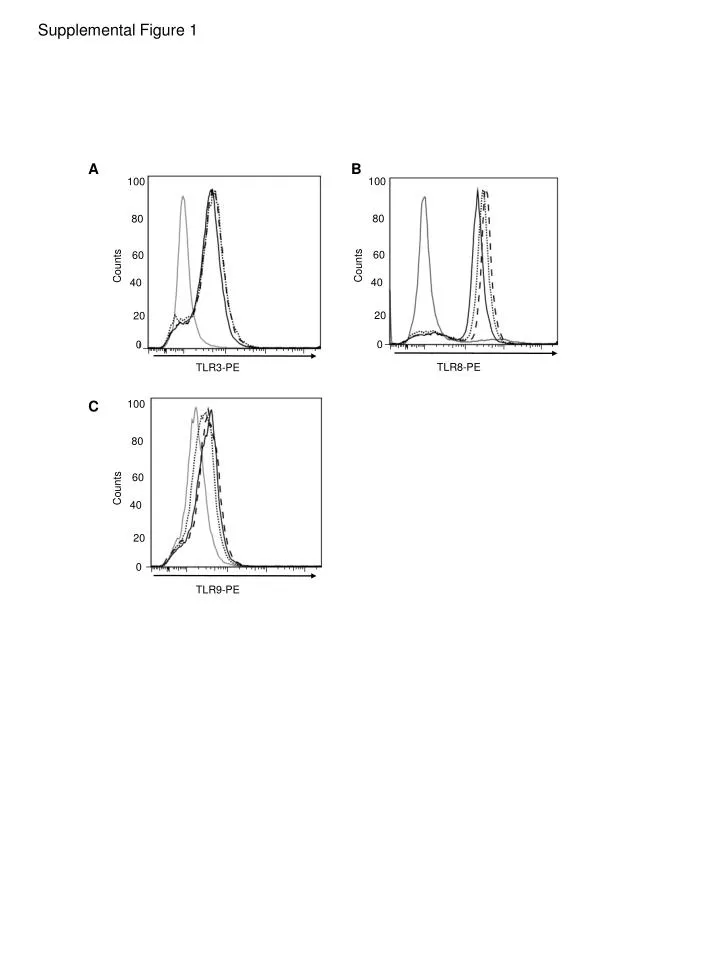
Supplemental Figure 1 A B 100 100 80 80 60 60 Counts Counts 40 40 20 20 0 0 TLR8-PE TLR3-PE C 100 80 60 Counts 40 20 0 TLR9-PE
Supplemental Figure 2 B A *** ** 1.5 ** 50 ** 250 40 1 200 No. of living cells (in million) 30 Percentage (apoptotic cells) 150 Counts 20 0.5 100 10 50 0 0 0 CL264+ Cisplatin CL264+ Cisplatin PBS PBS Cisplatin Cisplatin CL264 CL264 TLR7-PE
Supplemental Figure 3 ** ns ns ** 14000 ** ** 12000 ** 10000 8000 Tumor volume (mm3 ) 6000 4000 2000 0 PBS CL264 Cisplatin(100µM) Cisplatin(200µM) Cisplatin(300µM) CL264+Cisplatin(100µM) CL264+Cisplatin(200µM) CL264+Cisplatin(300µM)
Supplemental Figure 4 A B 7500 6000 4500 Tumor volume (mm3) day 28 3000 1500 0 CL264 Cisplatin IRS661 ODN - + - + - + - + - - + + - - + + - - - - + + + + + + + + - - - -
Supplemental Figure 5 CD3+ T cells CD4+ T cells B A ns ns ns ns 15 100 20 40 80 15 30 10 60 nb CD3+ cells (x106) %CD3+ cells among CD45+ cells nb CD3+ CD4+ cells (x106) %CD3+ CD4+ cells among CD45+ cells 10 20 40 5 5 10 20 0 0 0 0 CL264 CL264 PBS PBS CL264 PBS CL264 PBS CD8+ T cells CD3+ Foxp3+TReg cells C D ns ns ns 1.5 ns 3 8 10 3 15 8 6 1 2 2 10 %CD3+ Foxp3+ cells among CD45+ cells 6 %CD3+ CD8+ cells among CD45+ cells 4 nb CD3+ Foxp3+ cells (x106) nb Gr1- CD11b+ cells (x106) nb CD3+ CD8+ cells (x106) 4 0.5 1 1 5 2 2 0 0 0 0 0 CL264 0 CL264 PBS CL264 PBS CL264 PBS PBS CL264 PBS CL264 PBS Gr1-CD11c+ dendritic cells Gr1-CD11b+ macrophages E F ** ** ** ** 60 20 15 40 %Gr1- CD11b+ cells among CD45+ cells %Gr1- CD11c+ cells among CD45+ cells nb Gr1- CD11c+ cells (x106) 10 20 5 0 0 CL264 PBS CL264 PBS Gr1+CD11b+ MDSCs G ** ** 40 1.5 30 1 %Gr1+ CD11b+ cells among CD45+ cells 20 nb Gr1+ CD11b+ cells (x106) 0.5 10 0 0 CL264 CL264 PBS PBS
Supplemental Figure 6 P value Percentage of TLR7 expressingtumor cells
Supplemental Figure 7 P value Percentage of TLR7 expressingtumor cells
Supplemental Figure 8 1 • Responders =55/166 • Non-responders =111/166 • P = 0.00218 .8 .6 OverallSurvival (OS) .4 .2 0 0 20 40 60 80 100 120 Time(months)
Supplemental Figure 9 100 80 60 R2= 0.5084 p= 0.0009 40 % TLR7 in tumor cells in LN afterchemotherapy 20 0 0 20 60 80 100 40 % TLR7 in tumor cells in lungafterchemotherapy
Supplemental Figure 10 B LymphNode Downstaging 100 80 60 % TLR7 positive tumoral cells 100 40 A Tumor Downstaging 20 80 0 60 Yes No 40 % TLR7 positive tumoral cells 20 C 0 No Yes