Download
1 / 32
320 likes | 456 Vues
Updated DCLL TBM Neutronics Analysis. Mohamed Sawan 1 with Input from Mo Dagher 2 , Edward Marriott 1 , Brandon Smith 1 , and Clement Wong 3 1 UW – Madison, Fusion Technology Institute 2 University of California – Los Angeles 3 General Atomics. FNST Meeting UCLA August 12-14, 2008.

E N D
Updated DCLL TBM Neutronics Analysis Mohamed Sawan1 with Input from Mo Dagher2, Edward Marriott1, Brandon Smith1, and Clement Wong3 1UW – Madison, Fusion Technology Institute 2University of California – Los Angeles 3General Atomics FNST Meeting UCLA August 12-14, 2008
DCLL TBM Updated Neutronics Analysis • The DCLL TBM went through major design changes since the last time a technical design review was held in August 2006 • Detailed updated design configuration was released in April 2008 • The nuclear parameters for the DCLL TBM were updated for the current design • Initial 1-D calculations performed for ITER mid-plane radial build that includes the inboard FWS module • Calculations performed for configurations at the different vertical zones of TBM • Started 3-D analysis for the detailed CAD model using the DAG-MCNP code
DCLL TBM Design Design Change Highlights Original Design Concept Current Design Concept • Reversed PbLi Flow • Starting at the top • PbLi Inlet in back Channel with Downward flow • PbLi Outlet flow in Front channel Upward Flow • Replaced PbLi concentric pipe concept with two individual I/O Pipes • He Flow in FW is Un-Changed, 2 circuits, 7 passes per circuit • He Flow in Grid Plate is Modularized. • He Flow in Grid plate in radial direction • Multi-layered back plate design Configuration.
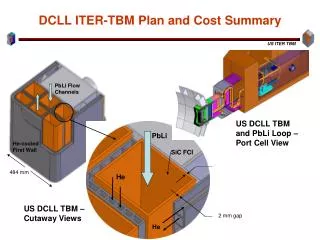
20 mm 20 mm DCLL TBM Design Features 20 mm gap inside frame opening • Frontal dimensions 48.4x166 cm (0.8 m2) • Radial depth 35 cm • Neutron wall loading 0.78 MW/m2 • 2 mm Be PFC on ferritic steel (F82H) FW • Lead lithium {Li17Pb83} eutectic enriched to 90% Li-6 • 5 mm SiCf/SiC inserts (FCI) used in all PbLi flow channels 1660 20 mm 484
A radial build is the homogenization of the material composition along the radial direction of the TBM starting from the FW The TBM is divided into seven vertical layers each representing a poloidal section of the TBM These sections are determined based on the internal design configuration of the TBM, in order to maintain a uniform vertical configuration in each vertical layer For each poloidal layer the radial zones are homogenized by determining the volume fractions of each material in the zone The material volume fractions for each zone were then used in neutronics calculations to determine the power density distribution throughout the corresponding poloidal layer DCLL Radial Build and Material Composition
Radial Build Layer Positions Layer 1 Layer 2 Seven Layers were used (Layer height shown in parentheses): • Top Plate (28mm) • PbLi Outlet (100mm) • Horizontal Grid Plate (20mm) • PbLi Inlet (120mm) • Midplane (1275mm) • Bottom Zone (93mm) • Bottom Plate (24mm) Layer 3 Layer 4 Layer 5 Layer 6 Layer 7
Layer 1 – Top Plate (28mm) View Showing Top Plate internal Details
Layer 2 – PbLi Outlet Manifold (100mm) Material Composition
Layer 3 – Horizontal Grid Plate (20mm) Material Distribution
Layer 3 – Horizontal Grid Plate, Power Density Distribution
Layer 4 – PbLi Inlet Manifold (120mm), Power Density Distribution
DCLL TBM Assembly Mid-Plane Section PbLi Outlet Channels (3) Inner He Distribution Manifold (Circuit 1) PbLi Inlet Channels (3) Divider Plate Plenum Outer He Distribution Manifold (Circuit 2) First Wall Grid Plates Grid Plate He Outlet Plenum Inner He Dist. Manifold (Circuit 2) He Outlet Plenum Grid He Inlet Plenum Outer He Distribution Manifold (Circuit 1) Back Plate
Mid-Plane Section View Represents 77% of TBM
Total Nuclear Heating in TBM • Power density in Be PFC 8.14 W/cm3 in layer 2 • Peak power density in FS structure 9.20 W/cm3 in layers 1,7 • Peak power density in PbLi 13.20 W/cm3 in layer 3 • Peak power density in SiC FCI 4.79 W/cm3 in layer 2
Tritium Production in TBM • Local TBR in the 35 cm thick DCLL TBM is only 0.561 • Tritium generation rate in the TBM is 1.55x10¹⁷ atom/s (7.73x10⁻⁷ g/s) during a D-T pulse with 500 MW fusion power • For a pulse with 400 s flat top preceded by 20 s linear ramp up to full power and followed by 20 s linear ramp down total tritium generation is 3.25x10⁻⁴ g/pulse • For the planned 3000 pulses per year the annual tritium production in the TBM is 0.97 g/year • Tritium production in the Be PFC is 1.54x10⁻⁹ g/s 6.47x10⁻⁷ g/pulse 1.94x10⁻³ g/year
Tritium Production Distribution in TBM • Peak tritium production rate in PbLi is 2.3x10⁻⁸ kg/m3s/year during the 500 MW D-T pulse
Radiation Damage in Steel Structure • Peak FS damage rates: • 9.73 dpa/FPY • 107 He appm/FPY • 472 H appm/FPY • For 0.57 MW/m2 average NWL and total fluence 0.3 MWa/m2 total lifetime is 0.526 FPY • Peak cumulative end-of-life dpa in FW is5.1 dpaand He production is56.3 He appm
Peak Radiation Damage in SiCf/SiC FCI • Peak SiC damage rates: • 9.14 dpa/FPY • 777 He appm/FPY • 291 H appm/FPY • 0.14% burnup/FPY • For 0.57 MW/m2 average NWL and total fluence 0.3 MWa/m2 total lifetime is 0.526 FPY • Peak cumulative end-of-life dpa in FCI is4.8 dpa, He production is409 He appm, H production is153 H appm burnup is 0.073%
Observations on Radiation Damage in SiCf/SiC FCI • Higher atomic displacement damage rates occur in C sublattice • He production in C is about a factor of 4 larger than in Si due to the (n,n´3a) reaction • Significant H production occurs in Si with negligible amount in C • Burnup of Si is about twice that of C • He production rate in graphite interface is ~60% higher than in SiC • The issue of lifetime was addressed in a recent paper: • M. Sawan, L. Snead, and S. Zinkle, “Radiation onentDamage Parameters for SiC/SiC Composite Structure in Fusion Nuclear Environment,” Fusion Science & Technology, vol. 44, pp 150 – 154 (2003). • The FCI is not a structural comp and main concern is change in resistivity resulting from transmutations • Transmutation of Si produce Mg and Al with smaller amount of P. The main transmutation product for C is Be with smaller amount of B and Li. This might not be a concern for the ITER low fluence but is important for a DEMO or power plant
Transmutation Products in SiCf/SiC FCI • Dominant metallic transmutation product is Mg • When DCLL blanket is used in a power reactor with 6 MW/m2 NWL, Mg concentration in SiC FCI at end-of-life of blanket (3 FPY) is 0.43 at% • Impact on conductivity should be addressed
Shielding Required Behind TBM • Criterion for maintenance access used in ITER is dose rate <100 mSv/h at 106 s after shutdown • Rules of thumb used to relate dose after shutdown from decay gamma of activated material to fast neutron flux • Formulas used in the ITER Nuclear Analysis Report, G 73 DDD 2 W 0.2, July 2004, relate the dose rate @106 s after shutdown to the fast neutron flux during operation • DR(mSv/h) ~ 1-3x10⁻⁵ FF(n/cm2s) • To be conservative we use the factor of 3x10⁻⁵ and assume the fast flux component with E>0.1 MeV • To satisfy the ITER guidelines for maintenance accessibility the fast neutron flux during operation should be <3x10⁶ n/cm2s (E>0.1 MeV) ~1.2 m thick shield is required behind DCLL TBM
3-D Neutronics Analysis for DCLL TBM • Calculations started using DAG-MCNP • Detailed CAD model for DCLL TBM is utilized • Helium in the current model is represented by void • A full PbLi volume has been created for analysis • A simplified CAD model with homogenized zones was generated for the frame (FW and shield regions) • TBM and Frame CAD models will be combined and the integrated model will be used in the calculations Solid Homogenized Cu-Steel Layer Solid Homogenized H2O-Steel Layer PbLi Volume FW Be Layer Exploded View Simplified Frame Model DCLL TBM
A Surface Source Is Used in The Calculations • An extra surface was inserted in front of equatorial port in the 40° sector model of ITER geometry • All particles crossing this surface were recorded (location, angle, energy, weight) • Surface crossings will be read as a surface source in front of integrated CAD model of frame and TBM • This properly accounts for contribution from the source and other components in the ITER chamber 2-D calculations for the TBM indicated that the 20 cm thick frame results in neutronics decoupling between TBM and adjacent shield modules with <2% effect. The frame has significant effect on DCLL parameters (up to 30%) and should be included Only half of the frame with a TBM is used in the calculations surrounded on the sides with reflecting boundaries Surface source
Features of Neutron and Gamma Surface Source Incident on TBM • Only 52% of neutrons incident on TBM are at 14 MeV due to significant secondary component from chamber components. Average neutron energy is 7.75 MeV • Number of secondary gamma photons incident on TBM is 37% of number of neutrons. Average gamma energy is 1.48 MeV • Neutrons have more perpendicular angular distribution compared to the mostly tangential secondary gammas