Download
1 / 27
270 likes | 355 Vues
Fingerprinting Native and Non-native Biodiversity, The Theory of Biotic Acceptance, and, the story of a challenging puzzle. Tom Stohlgren (USGS), John Schnase/Neal Most Team (NASA), Mohammed Kalkhan (CSU) Catherine Jarnevich, Tracy Davern, Geneva Chong (USGS),

E N D
Fingerprinting Native and Non-native Biodiversity, The Theory of Biotic Acceptance,and, the story of a challenging puzzle. Tom Stohlgren (USGS), John Schnase/Neal Most Team (NASA), Mohammed Kalkhan (CSU) Catherine Jarnevich, Tracy Davern, Geneva Chong (USGS), Paul Evangelista and David Barnett (CSU), with help from . . . Greg Newman, Jim Graham, Jon Freeman, Alycia Waters, Sara Simonson (NREL), John Kartesz (BONAP),Bruce Peterjohn, Pam Fuller (USGS), Curt Flather (USFS), and many others! Main Project Web Page http://www.NIISS.org Created Sept. 2004
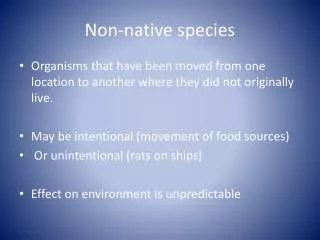
We define “biotic acceptance” as the tendency of natural ecosystems to accommodate the establishment and coexistence of non-native species despite the presence and abundance of native species. We’re simple ecologists, with a ground-up approach! Puzzle Piece #1: Talented and enthusiastic research team
Small-scale measurements? What allowed us to Scale-Up? • Woody Turner’s “Biological Fingerprinting” workshop in NY – a challenge to scale-up! • Local, state, national and international, interest in invasive species science and biodiversity. • Partnerships with scientists and program managers who are not afraid to think big (Jim, John, Ed, Woody, the Jeff’s, Neal (NASA); Sue, Sharon, Bob, Mark, Pam (USGS) and many others. • A talented and enthusiastic research team.
Puzzle Piece #2: Careful ground-based, multi-scale measurements
Bighorn Canyon NRA N. Mixed grass Riparian Charles Russell NWR Northern Mixed Prairie Wild Horse NWP Cushion Plant Yellowstone N.P. Wet Meadow Pipestone NM Tallgrass Prairie Mixed grass Old Aspen Wind Cave NP Mixed Grass Prairie Grand Staircase- Escalante NM Desert Shrub Desert MixedGrass Rabbitbrush Sage, Blackbrush Juniper, Desert Shortgrass Pinyon Pin- Pinyon-Juniper Pinyon-Juiper-Manzanita Pinyon-Juniper-Oak Pinyon-Juniper-Sage Aspen, Spring Wet Meadow Perennial Riparian Mountain Shrub Rocky Mountain N.P. Tundra Sublapine-Limber Pine Spruce Fir Lodgepole Pine Douglas Fir Ponderosa Pine Willow Wet Meadow Dry Meadow Aspen Shortgrass Steppe Riparian, Sage Ponderosa Pine Puzzle Piece #3: Comparable measurements in many vegetation types and biomes. 37 Vegetation types Mean = 19.6 plots/type Median = 11 plots per type 727 1000-m2 subplots 7,042 1-m2 subplots
5 y = 0.033x2 + 0.102x – 0.028 R2 = 0.132 P < 0.0001 Spring 4 3 Aspen CO Slope of Native to Non-native Species Richness 2 1 0 -1 Tallgrass 1 10 100 1000 Plot Area (m2) Puzzle Piece #4: Understanding the effects of scale on alpha diversity. Biotic acceptance increases among communities (regionally) and the changing relationship may be non-linear.
Puzzle Piece #5: Understanding the effects of scale on Beta diversity: i.e., at regional scales. Vegetation-type- and regional-scale Biotic acceptance increases more in communities high in beta diversity (i.e., high species accumulation curves; and high/optimum resources – water, light, nutrients, warmth).
Puzzle Piece #6: Understanding temporal changes in diversity: i.e., 400 years of invasion and continuing. Biotic acceptance may increase with increasing establishment of non-native species. This appears to be a much stronger force than the negative effects of native species richness and biomass with R2 values between 0.43 and 0.58.
Bighorn Canyon NRA N. Mixed grass Riparian Charles Russell NWR Northern Mixed Prairie Wild Horse NWP Cushion Plant Yellowstone N.P. Wet Meadow Pipestone NM Tallgrass Prairie Mixed grass Old Aspen Wind Cave NP Mixed Grass Prairie Grand Staircase- Escalante NM Desert Shrub Desert MixedGrass Rabbitbrush Sage, Blackbrush Juniper, Desert Shortgrass Pinyon Pin- Pinyon-Juniper Pinyon-Juiper-Manzanita Pinyon-Juniper-Oak Pinyon-Juniper-Sage Aspen, Spring Wet Meadow Perennial Riparian Mountain Shrub Rocky Mountain N.P. Tundra Sublapine-Limber Pine Spruce Fir Lodgepole Pine Douglas Fir Ponderosa Pine Willow Wet Meadow Dry Meadow Aspen Shortgrass Steppe Riparian, Sage Ponderosa Pine Puzzle Piece #7 Link with other studies – Past, present, and future: Stohlgren et al. 1997, 1999; Lonsdale 1999, Levine 2000, Stohlgren et al. 2001, 2003 The Present Gilbert and Lechowicz. 2005 Davies et al. 2005 Bruno et al. 2004 Keeley et al. 2003 Sax 2002, Dark 2004 Brown and Peet. 2003, Friedly et al. 2004 Bob Peet VegBank Data Jim Quinn Data Many other studies in different vegetation types are demonstrating biotic acceptance at multiple spatial scales or large scales.
Puzzle Piece #8: regional verification. Stohlgren et al. 2005a -- Geez! Those are very high R2 values!
Methods: (1) Gather data; (2) Assess data quality; (3) evaluate patterns (GIS maps, regressions, cross-correlations Puzzle Piece #9: Gather and evaluate national databases. Stohlgren et al. 2005b. Species richness and patterns of invasion in plants, birds, and fishes in the United States. Biological Invasions (In Press) Bruce Peterjohn (Breeding Bird Survey = 4,000 routes, 10 years, and bird atlases = life times of birding) John Kartesz, Biota of North America Program, Univ. North Carolina. (46 states, Over 3000 counties, 500,000 records, 10 years of research, standard reference). Pam Fuller, South Florida-Caribbean Science Center, USGS (10 years of Research, >200,000 records and Larry Master, NatureServe’s huge database). Stohlgren, Barnett, and Flather are just “data miners”
> 1080 Native plant species/county Non-native plant species/county > 170
Native bird species/county Non-indigenous bird species/county
Native fish species/watershed Non-indigenous fish species/watershed
Puzzle Piece #10: Quantify cross-taxa patterns Stohlgren et al. 2005b Biological Invasions (in press)
Results are encouraging, so far . . . • Native plant, bird, and fish densities generally track latitude, temperature, precip., and each other (i.e., habitat heterogeneity) all “proven” factors of “local determinism,” but no sign of the “saturation of species.” • Human factors (population, road density, land-use change) are weakly correlated to native diversity, and more strongly correlated to non-native diversity, but environmental factors may be more proximate predictors of native and non-native species diversity. • At county scales, non-native species densities also track native species densities (for plants, birds, and fish) – and the biological groups track each other – “the rich get richer” within and across biological groups, and this pattern is strongly predictable! This is great!
Tamarisk APHIS National Institute of Invasive Species Science Global Organism Detection and Monitoring System Objective:Capturing information (location data, species characteristics, and environmental attributes) on all taxa of invasive species to detect, control, and monitor their spread. Integrating these data to serve land managers, land owners, researchers, government officials, and the public. From the field… To the web… • Multiple data types • Upload via the web in three formats • Palm programs (weed mapping and vegetation survey) • GIS Shapefile • Tab-delimited text file • User maps fields to database fields • Require specific format (e.g. standardized measurements) • Based on enterprise database, custom COM objects, and ASP pages • Interactive map displaying invasive species distributions • Add new locations by clicking the map • Query the database by species, project, or area • Real-time statistics and links to research • Species profiles • Watch lists Rocky Mountain National Park To the modeling… • Current and potential abundance and distribution • Probability maps • Gaps in knowledge from uncertainty maps • Smart surveys • Select priority species and sites • Vulnerability and risk analysis Filed crews use palmtops downloaded to the database via phones or computers. To the future… • Tentative release date September 2005 • E-mail new species report to manager • On-line modeling capabilities • Download selected data • PDF report with map, profile, control information, and model To the database… • SQL Server- extensible and standardized • Three main, required fields • Area: geographic location • Visit: date area was visited • OrganismData: unique organism id for a visit • Capture metadata, auxiliary data, spatial data (e.g. shapefile for area), treatments (control information), etc. Probability of occurrence for leafy spurge in Colorado modeled and tested using informations from 45 datasets. Puzzle Piece #11: Improve data handling and promote data sharing. URL: http://www.niiss.org
Puzzle Piece #12: Improve data accessibility -- www.niiss.org
Puzzle Piece #13: Developing strategies for others to effectively use your data, capabilities, and services – e.g., Risk Assessment and Early Detection / Rapid Response Needs Site Need to know: 1. Current distribution and abundance, 2. Data completeness, 3. Potential dist. and abund., 4. Potential rate of spread, 5. Risks/Impacts (env. & econ & human health) 6. Containment Potential 7. Opportunity costs 8. Legal mandates To select Priority Species and Priority Sites County, State, Region Nation Rarely done Stohlgren, T. and J. Schnase. 2005. Biological hazards: What we need to know about invasive species. Risk Analysis Journal (In Press) Requires modeling
Puzzle Piece #14: Improve spatial modeling and forecasting capabilities. THE KEY PIECE TO THE PUZZLE! For more information see www.NIISS.org
Preliminary Model of Potential Spread in 10 Years Control/ Restoration Monitoring Sites Early Detection Rapid Response Sites Priority Survey Sites Containment Boundary 10 Years
Puzzle Piece #15: Adjust to changing customer needs. Hackberry Canyon Watershed, Utah “Presence Maps” Tamarisk locations “Biomass Maps” (g/0.5m2)
We have many pieces of the puzzle in place. We are integrating across disciplines and programs (NASA/USGS). We have made progress in many areas. We are producing valuable products. We still have much of our work ahead of us to complete the puzzle. Great Research Team Many more datasets Alpha, Beta, and Gamma diversity Fail-proof Web-service Multi-scale Surveys Web focus and tools Many more taxa (diseases/ pathogens) Improved Decision Support Additional Spatial & Temporal models Automated data ingest and modeling Cross- Taxa tests Fine- Scale Maps Spp. + habitats Improved data handling and access Backup systems Regional & National data NIISS Local/ Regional verification Cluster computing and modeling Links to other studies Customers are lining up EDRR For more information see www.NIISS.org
Lots on invaders! More every day! Plant, Animals, and Diseases Aquatic and Terrestrial
Managing Invasive Species is: • Urgent: Extremely high demand for meeting more customers needs. Need technology assisted field techniques; iterative field and modeling methods for invasive species surveys; data entry/mapping tools linked to large relational databases, remote sensing, and GIS tools, and economic analyses – NOW! 2. Difficult: Issues of scaling, data synergy, data hording, limited funds, multiple spatial scales, multiple biological groups, and human and animal behavior. It also involves a “Grand Challenge” Ecological forecasting of biological organisms – frontiers in science. 3. Costly: Prevention, early detection and rapid assessment, survey and monitoring, research, and restoration carry a high price. BUT – the cost of inaction is far greater $120 B/yr, lost production, increased maintenance, species loss, habitat degradation, costs to human health!
Biodiversity Outlook: • Over much of the US, and maybe the globe, “the rich get richer.” • The invasion is in the early stages. • Establishment + inevitable disturbance will facilitate future invasion. • More sites will become dominated by invaders over time. • Species extinction will be slow, but significant, relative to the invasion. • Coexistence is the rule – but extirpation, hybridization, habitat degradation, diseases, pathogens, and extinction are inevitable!
Scale-Up! Speed up! Invest More! For more information see www.NIISS.org