Download
1 / 6
60 likes | 81 Vues
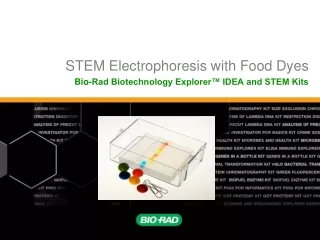
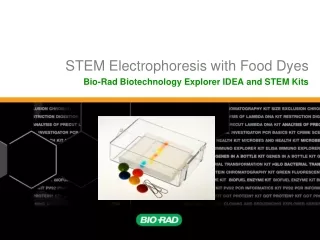
Analysis of Food Dyes in Beverages. Spectometry and Beer’s Law. In lab notebooks, fill out: Title Source Partners Date Purpose Safety considerations Materials (can glue in) Then, answer the “Pre-Lab Questions” (be sure to glue in the questions that you received in class! )

E N D
Analysis of Food Dyes in Beverages Spectometry and Beer’s Law
In lab notebooks, fill out: • Title • Source • Partners • Date • Purpose • Safety considerations • Materials (can glue in) • Then, answer the “Pre-Lab Questions” (be sure to glue in the questions that you received in class! ) • Copy down “Introductory Activity” Procedures (can glue in)
Intro Activity • You would have run the stock solution and dilutions with known concentrations through the spectrophotometer to measure the %T in order to create a calibration curve so that we have something to compare an “unknown” to. The cuvettes we use are 1.0 cm.
Glue following data table in your notebooks (I put a PDF of it on my website- just print and glue.)after the Intro Activity Procedure. The %T are values that you would have acquired (or close to), if you had actually run the stock blue dye and diluted standards through the spec.
After copying the data table…(1) Complete #7 and 8 from “Introductory Activity” (show work!). Fill out the data table with your answers.(2) Complete #9 from “Introductory Activity”, but you only need to create 1 graph, not 5. Absorbance vs. Concentration of Dye is the only one required! Glue it in your notebook after your work for #7 and 8. BE SURE YOUR GRAPH HAS THE AXES LABELED AND A PROPER TITLE! You can use a computer program to do this, and just print and glue it in.
Calculation Hints: • First convert %T to T (move decimal) • Convert to Absorbance (A = -logT) • Use Beer’s Law to calculate concentration (in micromolar) of each using the absorbance measured (like prelab question #3, only solving for C instead of A). Use the same value for εthat was given in prelab question #3.