Download
1 / 24
240 likes | 340 Vues
CSE891-001 2012 Fall. Summary. Goal: infer models of transcriptional regulation with annotated molecular interaction graphs

E N D
CSE891-001 2012 Fall
Summary • Goal: infer models of transcriptional regulation with annotated molecular interaction graphs • The attributes in the model correspond to verifiable properties of the underlying biological system, such as the existence of PPI and protein-DNA interactions, the directionality of signal transduction in PPIs, as well as signs of the immediate effects of these interactions • The most likely settings of all the variables, specifying the most likely graph annotations, are found by a recursive application of the max-product algorithm.
Challenges • The challenge arises in part from the apparent complexity of regulatory systems • involving diverse physical mechanisms of control • Involving complex networks of molecular interactions mediating such mechanisms • To unravel such systems effectively, we need both sufficient experimental data probing relevant aspects of such systems, as well as computational approaches that aid in the large scale reconstruction of the underlying molecular biology.
Simplified Model • TF-promoter bindings and cascades of protein modifications or interactions form the basis of transcriptional initiation and signal transduction pathways. • External stimuli are propagated via signal transduction pathways to activate TFs, which in turn bind to promoters to enable or repress transcription of the associated genes. • Assumption: gene regulatory processes are carried out along pathways of physical interaction networks.
Physical Network Model - Concepts • By integrating multiple sources of data, we infer annotated molecular interaction networks • The existence of interactions and their annotations are represented by variables. • Each annotated interaction network is represented by a particular setting of all the variables. • The available data biases the setting of the variables, therefore giving rise to the most likely hypothesis about the annotated interactions networks. • The output of the approach is one annotated physical network, including the presence of specific interactions, causal directions and immediate effects of such interactions, and active pathways.
Skeleton Graph - Concept • The basic directed network which contains possible molecular interactions is called a skeleton graph • The direction of a protein–DNA edge is determined a priori • In contrast, the direction of a PPI edge is initially undetermined as we do not necessarily know the regulatory processes where the interaction occurs • Problems: • If a skeleton graph contains all possible physical interactions, it could in principle be a complete graph • By limiting ourselves to the skeleton graph, we may be affected by false negatives, interactions without any support in the available interaction data
Skeleton Graph - Annotation Three types of data are used to estimate the physical network models: protein-DNA, protein-protein, and single gene knock-out expression data.
Skeleton Graph - Assumptions to cope with the limited data • We view cascades of molecular interactions as the primary causal mechanisms underlying gene regulation • We assume that the effect of gene deletions propagates along the molecular cascades represented in the model • We collapse PPIs together with protein modification; we consider only the case that each PPI possesses a unique direction in the pathways in which it participates. • We assume that the regulatory circuitry is not radically changed following a knock-out, at least not in terms of how the effects of the deletion are propagated
Data Association • The values of the variables specifying the physical network model can be inferred from the available data • To achieve this, we must tie the setting of the variables to specific measurements • Some of the variables, such as presence or absence of protein-DNA interactions, can be directly associated with individual measurements. • Others, such as the signs of the edges denoting either repressive or activating interactions, need to be inferred indirectly based on responses to gene deletions.
Data Association For a binary variable x indicating the presence/absence of a protein-DNA edge, the measurements pertaining to this variable are incorporated into the model according to the Error Model(likelihood ratio): The value of x more consistent with the observed data yields a higher value of the potential function. Potential functions as likelihood ratios are combined by multiplication across independent observations.
Data Association Build the potential functions for biasing the presence of edges. We obtain the likelihood ratio for the potential function φ. We assume that the likelihood ratio is the same for all edges and has the value 0.9, indicating a slight bias against an edge. The potential function is therefore φ(xi) = (0.9)xi. The sample skeleton graph, in which all the edges are protein-DNA interactions and so their directions are specified a priori.
Data Association Suppose the only data available is from the g1 deletion experiment and only g4 is significantly down-regulated in response to the knock-out, denoted as (g1, g4, −). Two explanations for this effect given by the two alternative paths from g1 to g4. The aggregate sign along the path must be the negative of the knock-out effect -> potential function The sample skeleton graph, in which all the edges are protein-DNA interactions and so their directions are specified a priori. OR
Potential Function φ Assume that the p-value comes from testing the null hypothesis H0 (the binding does not occur) against the alternative hypothesis H1 (the binding occurs). Under certain regularity conditions, the asymptotic sampling distribution of the log likelihood ratio statistic is χ2 with degrees of freedom 1, assuming the difference in the degrees of freedom in the two hypotheses is 1. The value of the log-likelihood ratio statistic is: where p is the reported p-value and F (.) is the cumulative χ2 distribution (CDF) with one degree of freedom.
Potential Function φ Cumulative distribution function Where k is the degree of freedom, Γ(k/2) denotes the Gamma function which has closed-form values for even k, γ(k,z) is the lower incomplete Gamma function and P(k,z) is the regularized Gamma function.
Potential Function φ Eventually, where n=3
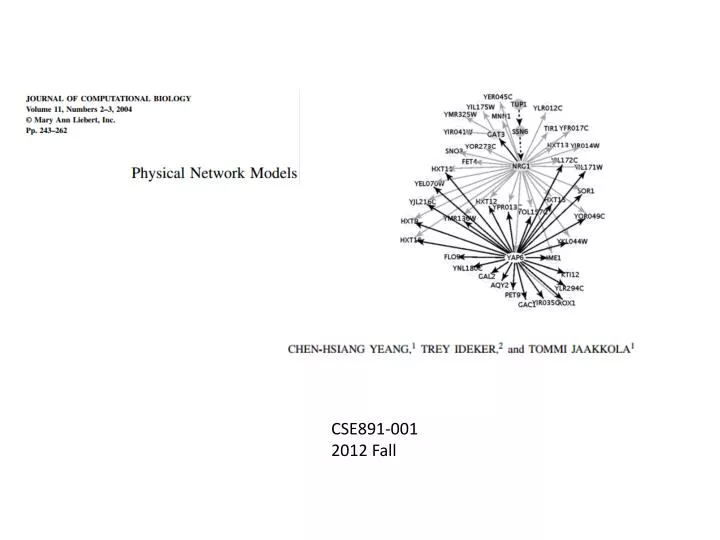
Results A small scale analysis involving the yeast mating response
Results Solid lines correspond to protein-DNA and dash lines represent PPIs
Results • By choosing p-value threshold 0.001, we extracted 5,485 protein-DNA pairs from Lee et al., 2002 • There are 14,876 PPIs of yeast proteins reported in the DIP database • By choosing the p-value threshold to be 0.02, we extracted 23,766 pairwise knock-out effects from Hughes et al., 2000 • The results reflect primarily the lack of systematic knock-out data to constrain annotations of interaction networks Genome-wide analysis
Conclusions • A new modeling framework for reconstructing annotated molecular networks from multiple sources of data • The resulting annotated molecular interactions networks were shown to be highly predictive about knockout effects in a cross-validation setting involving the yeast mating pathway • In a genome-wide analysis, a much smaller fraction of knock-out effects could be explained by short paths


![Distributed systems [Fall 2010] G22.3033-001](https://cdn3.slideserve.com/6700193/distributed-systems-fall-2010-g22-3033-001-dt.jpg)