Download
1 / 4
60 likes | 707 Vues
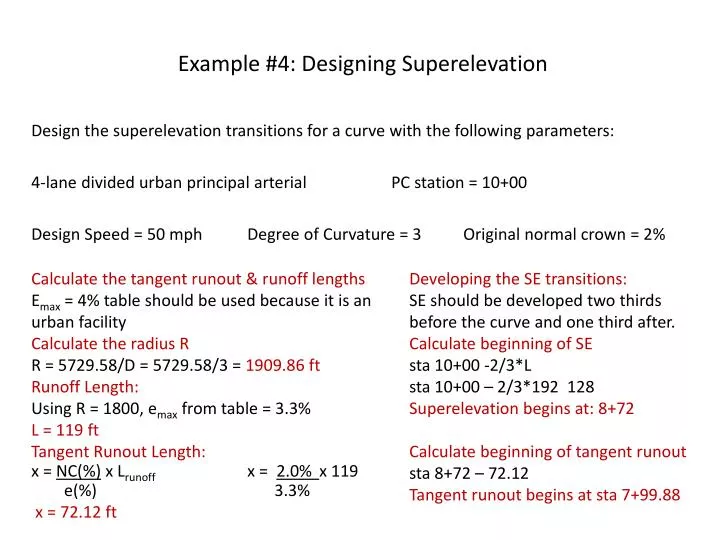
Example #4: Designing Superelevation. Design the superelevation transitions for a curve with the following parameters: 4-lane divided urban principal arterial PC station = 10+00 Design Speed = 50 mph Degree of Curvature = 3 Original normal crown = 2%.

E N D
Example #4: Designing Superelevation Design the superelevation transitions for a curve with the following parameters: 4-lane divided urban principal arterial PC station = 10+00 Design Speed = 50 mph Degree of Curvature = 3 Original normal crown = 2% Calculate the tangent runout & runoff lengths Emax = 4% table should be used because it is an urban facility Calculate the radius R R = 5729.58/D = 5729.58/3 = 1909.86 ft Runoff Length: Using R = 1800, emax from table = 3.3% L = 119 ft Tangent Runout Length: x = NC(%) x Lrunoffx = 2.0% x 119 e(%) 3.3% x = 72.12 ft Developing the SE transitions: SE should be developed two thirds before the curve and one third after. Calculate beginning of SE sta 10+00 -2/3*L sta 10+00 – 2/3*192 128 Superelevation begins at: 8+72 Calculate beginning of tangent runout sta 8+72 – 72.12 Tangent runout begins at sta 7+99.88
Example #6: Locating Vertical Curve Elevations A crest vertical curve with a length of 400 ft connects grades +1.0% and -1.75%. The VPI station 35+00 and elevation 549.2 ft. What are the elevations and stations of VPC & the VPT? VPI Elevation = VPC elev +G1*L/2 VPI Station = VPC station + L/2 VPC=549.20 - 0.01*400/2 VPC elevation = 547.20 ft VPC station = 3500–400/2 VPC station = 33+00 VPI Elevation = VPT elev - G2*L/2 VPT Station = VPC station + L VPT=549.20 + (-0.0175)*400/2 VPT elevation = 545.70 ft VPT station = 3500+400/2 VPT station = 37+00
Example #7: Designing a Crest Vertical Curve Design a length of vertical curve for a crest curve based on SSD and the following information: Design Speed = 40 mph g1 = 1.25% g2 = -2.75% Solution: Determine the change in grade elevation A = |g2-g1| = |-2.75-1.25| A = 4.0% AASHTO Design Controls for SSD (Exhibit 3-76) - Min. SSD = 305 ft Assuming S > L L = 2S -2158/A L = 2*305 -2158/4 L = 610-539.50 L = 70.5 ft Assumption is correct S > L, We have found the minimum length of curve! Remember MoDOT recommends a length of curve of at least 300 ft when possible. What if we had started with this assumption ? S < L L = AS2/2158 L = 4*3052 /2158 L = 172.43ft S < L, Assumption is wrong, would have had to use the other formula to obtain the correct answer
Example #8: Designing a Sag Vertical Curve Design a length of vertical curve for a sag curve based on • Comfort Ride • Headlight Sight Distance Design Speed = 40 mph SSD = 305 g1 = -3.2% g2 = +2.4% Solution: Determine the change in grade elevation A = |g2-g1| = |2.40-(-3.2)| A = 5.6 % Headlight SD: Assume S < L: L=AS2/(400 +3.5S) L = 5.6*3052/(400+3.5*305) L = 520940/1467.5 L = 354.98 ft S < L Assumption is correct Comfort Ride Equation L=AV2/46.5 L = 5.6*402/46.5 L = 192.69 ft Remember, MoDOT rounds length of vertical curve to the nearest 10 ft Headlight SD: Assume S > L: L = 2S – [(400 + 3.5S)/A] L = 2*305-[(400+3.5*305)/5.6] L = 610 – 262.05 L = 347.95 ftS < L Assumption is wrong, let’s try again