Download
1 / 2
20 likes | 69 Vues
Helen E, Zoltan E & Hamizah H. GRAVITY. Introduction The gravity survey was done on three lines which are shown on the map below. The main aim of this survey is to get an overview of

E N D
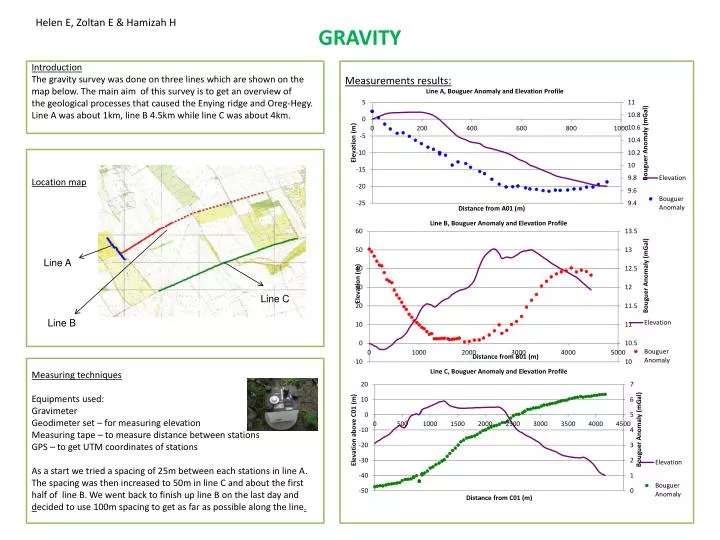
Helen E, Zoltan E & Hamizah H GRAVITY Introduction The gravity survey was done on three lines which are shown on the map below. The main aim of this survey is to get an overview of the geological processes that caused the Enying ridge and Oreg-Hegy. Line A was about 1km, line B 4.5km while line C was about 4km. Measurements results: Location map Line A Line C Line B Measuring techniques Equipments used: Gravimeter Geodimeter set – for measuring elevation Measuring tape – to measure distance between stations GPS – to get UTM coordinates of stations As a start we tried a spacing of 25m between each stations in line A. The spacing was then increased to 50m in line C and about the first half of line B. We went back to finish up line B on the last day and decided to use 100m spacing to get as far as possible along the line.
Inversion results Preliminary model for line C The above model includes only the long wavelength structure. We have interpreted this to be a syncline in the basement rock with an amplitude of 4km, then filled in with sediment. However this result is non-unique. Line B Line C Line A Survey lines overlain on a Bouguer anomaly map (contour lines 1mGal apart) • Appliedinversion • Corrections done on raw gravity reading: • 1. Tide : gravity variations due to attractions of the sun & the moon • 2. Drift: gravimeter drift due to its spring’s elastic creep • Gravity • (mGal) • Time from 1st reading (mins) • 3. Latitude: earth’s rotation and its elliptical shape • 4. Terrain: variation in gravity due to topographic variations • 5. Free Air: variations caused by elevation differences between stations • 6. Bouguer: gb = 0.04193ph • To model the subsurface we used GM-sys, which calculates the gravity response • of a defined geologic model. Summary Summary Gravity lines B and C have so far provided ideas of the sub-surface structure around Enying Ridge. The Bouguer anomaly profile along line C is typical for that of a vertical fault and line B may indicate a dipping fault. Preliminary forward modelling has produced a large syncline but this may be transformed into a fault with further interpretation. The next thing to do is focus on the near-surface structure, such as the limestone, in order to fit the small –scale variations in the gravity anomaly. • References • Principles of applied geophysics by D.S.Parasnis • Field Geophysics by Melson • 3. Applied Geophysics by Telford, Geldart, Sheriff & Keys Thank you to Prof Greg Houseman & P’roska for guidance