Download
1 / 25
260 likes | 342 Vues
Voyager 1 CRS Update . SSG Meeting JHU/APL 9 September 2013.

E N D
Voyager 1 CRS Update SSG Meeting JHU/APL 9 September 2013
V1 H, He, C, and O spectra for 2012/342-2013/161. Spectra flattten below few hundred MeV/nuc due to ionization energy losses.Believe we are observing GCRs down to ~3 MeV/nuc for H and He;C & O down to ~5 MeV/nuc.GCR H, He spectra peak at ~10-40 MeV/nuc with H/He ratio =13 at 7.8-57 MeV/nuc. GCR C/O ratio ~1. ACRs not contributing to low-energy GCR spectrum, contrary to Scherer et al 2008. Moskalenko et al. 2002 – DC Webber & Higbie 2009 -- LB Fisk & Gloeckler 2012 -- pump GALPROP tuned to ACE by Lave et al 2013
Preliminary V1 spectra for 2012/342-2013/161 for 8 elements (red). Also shown are spectra from a reference period (blue, 2011/1-365),dominated by ACRs below ~50 MeV/nuc.So, for first time at low energies V1 is observing GCRs in LISM at true energies – no adiabatic energy loss effects.
Preliminary V1 spectra for 2012/342-2013/161 for 8 elements together with two GALPROP unmodulated spectra propagated to near Sun with parameters tuned by Lave et al. 2013 to match ACE observations at 1 AU. Conventional model with reacceleration matches ACE and Voyager data better than plain diffusion model.
GCR abundance comparisonThe GALPROP conventional model with reacceleration is shown and matches Voyager data quite wellSystematic trends in 1 AU data is due to modulation.
Gradients? 100 MeV H vs time from Strauss et al. 2013. Gradient ~0.5%/AU for ~60 AU after heliopause.
Krimigis et al., 2013 CRS HET 2 Guard singles rate
Other singles rates show statistically significant variations that presumably are due to varying anisotropy
Preliminary GCR electron spectra. Two spectra due to use of two different sets of response functions: Open: pre-flight accelerator calibration Solid: Geant4 simulation Difference indicates level of systematic uncertainty. Parameters of power-law fits: Open: dJ/dE = 276*(E/10)-1.55 Solid: dJ/dE = 284*(E/10)-1.37
Preliminary Working on adding electron points from HET B end of telescopes. Parameters of power-law fit: dJ/dE = 270*(E/10)-1.69
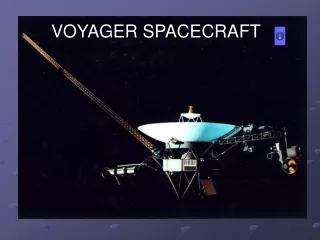
Voyager 1 Cosmic Ray Telescopes HET 1 & 2 will be the focus for next part of talk. Nominal look directions in NT plane are shown. HET 1 HET 2 TET Direction of rotation for magrols and LECP offpoints A Bmag V A
Voyager HET:PEN rate is defined by B1.B2.C1~40 degree full opening angle(bi-directional)
Recent magrol times shown Krimigis et al., 2013 Magrol #’s 66 67 68 69 70 71 72
Average of rolls 64-66 (left) shows no significant anisotropyAverage of rolls 68-72 (right) does show an anisotropy – two dips 180 degrees apart due to bi-directionality of telescopes for penetrating events
Pitch angle distribution for rolls 68-72 Minimum at 90o pitch angle. Full angular width ~ same as opening angle of telescope -> could be a 100% dropout only a few degrees wide right at 90o. 40o
Note: 70 degree LECP offpoint location shows a bigger effect in HET 1 than in HET 2 for rolls 71 and 72.
And that is consistent with distance from 70 degree offpoint location to 90 degree pitch angle for rolls 71 and 72 (72 shown): smaller in HET 1 (~15o) than in HET 2 (~22o).Note: using average field direction from Science paper would flip this around and be inconsistent. HET 1 HET 2
Summary • Observing local interstellar GCR H and He spectra down to ~3 MeV/nuc and GCR C and O down to ~5 MeV/nuc. • 45-90 MeV/nuc: GCR B/C = 0.14 C/O = 1.1 • 7.8-57 MeV/nuc: GCR H/He = 13.0 • Good agreement with GALPROP conventional diffusive reacceleration model tuned by Lave et al. 2013 to match ACE observations at 1 AU. • ACRs not contributing to low-energy GCR spectrum, contrary to Scherer et al. 2008 • GCR electron spectrum in LISM ~E-1.3to ~E-1.7 from ~3-70 MeV. • No GCR gradients so far • Small time variability in some rates likely due to variation in anisotropy of GCRs • GCR anisotropy likely due to drop out of particles within a few degrees of 90o pitch angle • With more analysis of the angular efficiency of the HET telescopes and more analysis of both the magrol and LECP offpoint data, it should be possible to better quantify the characteristics of the notch