Download
1 / 78
790 likes | 941 Vues
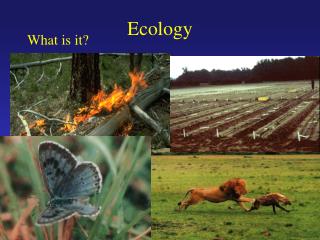
Ecology. Biology 30. Ecology. Study of Ecosystems Abiotic & Biotic factors interacting Biotic Factors include populations & communities. Population Same species Same place Same time. Community Groups of pops interacting. Same species: Same place: Same time!.

E N D
Ecology Biology 30
Ecology • Study of Ecosystems • Abiotic & Biotic factors interacting • Biotic Factors include populations & communities • Population • Same species • Same place • Same time • Community • Groups of pops • interacting
Can you explain the difference between a population and a community? • The definition for a population? • The definition for a community?
Biotic and Abiotic Factors? Abiotic factors are the non-living components of an ecosystem Biotic factors are the living components of an ecosystem
Can you tell me… • The difference between abiotic and biotic factors in an ecosystem? • An example of an abiotic factor? • An example of a biotic factor?
Ecosystem Community or Population? Community _________________
Why is the picture in the previous slide an example of a community and not an example of a population?
Populations • Variables we will consider: • Geographic Range • Habitat • Ecological Niche • Population Distribution • Population Size • Population Density • Population Growth Rate and Patterns
Geographic Range • area where animal has been seen
Fire Ant Range Geographic range can change over time due to abiotic factors.
Range Changes in Moose Populations How has the geographic range of moose changed since the 1870’s??
Habitat • area where the population lives • where environmental conditions are best for survival
How does an organism’s geographic range differ from its habitat?
Ecological Niche • Role of the species in the community • Includes ALL biotic and abiotic factors a species needs to survive Each group has a different role to minimize competition
Populations co-exist only if each group occupies a different niche
Population Distribution Uniform Clumped
Population Distribution • Determined largely by habitat preference • Divided into three patterns: 1. Clumped - individuals grouped in patches due to certain environmental factors (e.x. trees clump on south slopes of river valleys b/c less direct sunlight and sturdier soils) • 2. Random • - not very common • - biotic and abiotic factors have little effect
3. Uniform • competition among individuals for resources results in regular spacing
What is the difference between clumped, random and uniform population distribution? • What factors are responsible for creating clumped, random and uniform population distributions?
Population Size • Number of organisms of same type in same place, at same time • There are 2000 students at CentreHigh during the 2004/5 school year. • Can be determined by exact count or estimation!!
N D = ______ S Population Density • Describes number of organisms in a defined area • eg. Snow geese at Beaver Hills = # of geese per hectare • Density (D) calculated by dividing total number (N) by amount of space occupied (S) by the population
What is the difference between population size and population density?
80000 D = _______ 50 Density Example There are 80000 snow geese in a 50 hectare area in 1995. D = N/S = 1600 snow geese per ha
If 200 lemmings are living in a 25 hectare (ha) area of tundra, what is the population density of this area? • Use the formula D = N/S
N rN = _____ T Growth Rate • After finding the population density, we can find the rate of change over time Change in number Change in time Rate of growth
rN = Density Change example • In 1993, the mouse population in my backyard was 50 mice/acre. After three years, various control measures had been in place, and the population dropped to 10 mice/acre. Calculate the rate of density change. 50 - 10 13.3 mice/acre/year = _______ 3
When arriving at their summer cabin, the Smiths discovered 10,000 cockroaches roaming throughout their 1000 m2 cabin. After 1 week, the exterminators were able to control the situation and reduced the cockroach population to 10 per 1000 m2. Calculate the rate of density change.
Population Growth • Determined by four factors: • Natality • Mortality • Immigration • Emmigration
N CGR = Population Growth CGR = (deaths + emmigration) (births + immigration) Initial # of organisms Also known as per capita growth rate N
Births Immigration 0 40 Deaths Emigration 0 55 Calculation • Using this table, calculate CGR for Sandhill cranes: Original Pop = 200
N -15 CGR = = 200 N CGR = 40 - 55 200 = -0.075
Puffins are small marine birds found off the coast of Atlantic Canada. Calculate the population growth rate of a puffin colony based on the following population in 1999. Original population = 200 000 Natality = 15 000 Mortality = 10 000 Immigration = 175 000 Emigration = 160 000
Density Problem Calculate the population density of shrews per m2, if an average of 7.8 shrews are found in an area 14 m wide by 20 m.
CGR Calculation N N CGR = Calculate the per capita growth rate of a mouse population if the original population size is 34 and over a period of a week, 5 die, 8 are born, 12 immigrate into and 7 emigrate out of the area.
Dynamic Equilibrium • Present in mature ecosystems • Characterized by long term balance • Pops remain relatively stable over time • Great biodiversity = stability • Can be compared with homeostasis
2 population types: 1. Open populations: • immigration & emigration occurs 2. Closed populations: • Density changes are result of natality and mortality only • No immigration or emigration • eg. Game preserves
Growth Curve • Graph showing changes in a population over time. • X = time (independent or manipulated variable) • Y = density or # of organisms (dependent or responding variable)
Growth Curve for Closed System • 4 phases: • 1. Lag phase…slow…not enough reproducing organisms • 2. Growth phase….exponential increase • 3. Stationary phase….natality= mortality • 4. Death phase…decline • Not always present
Bacterial Growth Curve Closed population 4 distinct phases
Draw a growth curve for a closed population. Label and define the four stages of this curve.
Growth Curve for Open Systems • When a limiting factor is introduced to a population, curve results in an “S” shape • Typical of an organism placed in a new environment • As organisms respond to increased nutrients, natalityincreases. • Equilibrium is established again and curve levels off • New carrying capacity (max. # of individuals environment can support)
Define carrying capacity. • When does a population growth curve of an open system show an “S shape”?
Population Growth Curves • Click on the link above • Read the instructions and hit the “run applet” button • Set the carrying capacity to 1000 • Set the birth rate to 1.5 • Hit RUN • View the graph and draw this in your notes • Have you simulated an open or a closed population? • Change the parameters and try it again!