Download
1 / 13
130 likes | 275 Vues
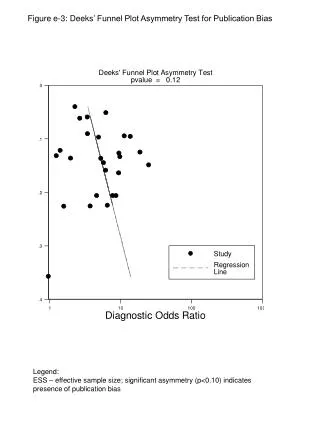
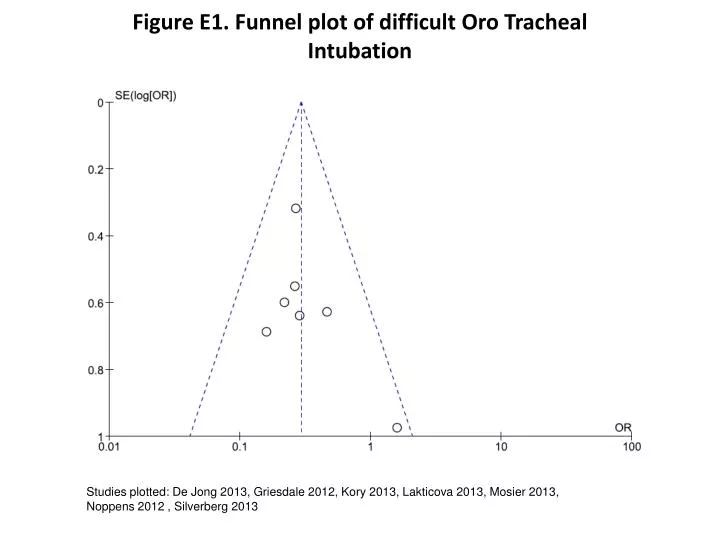
Figure E1. Funnel plot of difficult Oro Tracheal Intubation. Studies plotted : De Jong 2013, Griesdale 2012, Kory 2013, Lakticova 2013, Mosier 2013, Noppens 2012 , Silverberg 2013. Figure E2. Funnel plot of first- attempt success.

E N D
Figure E1. Funnel plot of difficultOroTracheal Intubation Studiesplotted: De Jong 2013, Griesdale 2012, Kory 2013, Lakticova 2013, Mosier 2013, Noppens 2012 , Silverberg 2013
Figure E2. Funnel plot of first-attemptsuccess Studiesplotted: De Jong 2013, Griesdale 2012, Kory 2013, Lakticova 2013, Mosier 2013, Noppens 2012 , Silverberg 2013, Ural 2011, Yeatts 2013
Figure E3. Funnel plot of glottisview Studiesplotted: De Jong 2013, Griesdale 2012, Mosier 2013, Noppens 2012 , Silverberg 2013
Figure E4. Forrest plot of difficultOroTracheal Intubation includingGlidescope® studiesonly M-H = Mantel-Haenszel
Figure E5. Forrest plot of first-attemptsuccessincludingGlidescope® studiesonly M-H = Mantel-Haenszel
Figure E6. Forrest plot of glottisviewincludingGlidescope® studiesonly M-H = Mantel-Haenszel
Figure E8. Forrest plot of difficultOroTracheal Intubation includingrandomizedcontrolled trials only M-H = Mantel-Haenszel
Figure E9. Forrest plot of first-attemptsuccessincludingrandomizedcontrolled trials only M-H = Mantel-Haenszel
Figure E10. Forrest plot of glottisviewincludingrandomizedcontrolled trials only M-H = Mantel-Haenszel
Figure E11. Forrest plot of difficultOroTracheal Intubation excludinghighrisk of biasstudy M-H = Mantel-Haenszel
Figure E12. Forrest plot of first-attemptsuccessexcludinghighrisk of biasstudy M-H = Mantel-Haenszel
Figure E13. Forrest plot of glottisviewwithoutexcludinghighrisk of biasstudy M-H = Mantel-Haenszel
Figure E14. Forrest plot of first-attemptsuccessexcluding trauma study M-H = Mantel-Haenszel