Download
1 / 24
281 likes | 892 Vues
SKETCHING THE GRAPH USING THE FIRST DERIVATIVE TEST. Standard of Competence : 6. To use The concept of Function Limit and Function deferential in problem solving. Basic Competenc e : 6.4 To use The derived to find the caracteristic of functions and to solve the problems. Indicator :

E N D
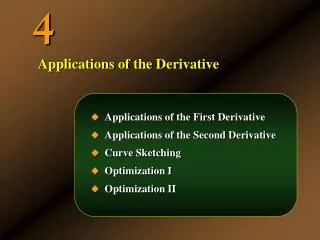
Standard of Competence:6. To use The concept of Function Limit and Function deferential in problem solving Basic Competence: 6.4 To use The derived to find the caracteristic of functions and to solve the problems • Indicator: • To find the function increases and the functiondecreases by first derivative concept • To sketch the function graph by the propertis of the Derived Functions • To find extreem points of function graph
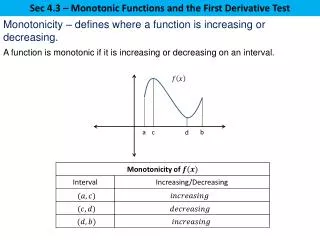
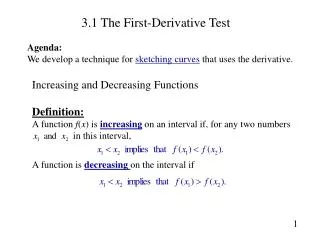
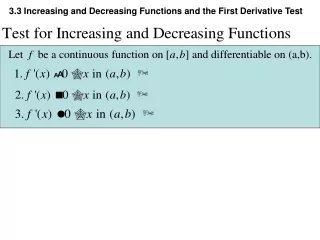
A function is increasing when its graph rises as it goes from left to right. A function is decreasing when its graph falls as it goes from left to right. dec inc inc
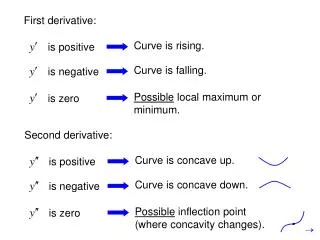
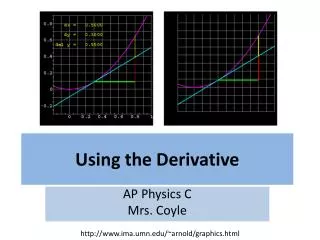
The increasing/decreasing concept can be associated with the slope of the tangent line. The slope of the tangent line is positive when the function is increasing and negative when decreasing
Find the Open Intervals on which f is Increasing or Decreasing
Find the Open Intervals on which f is Increasing or Decreasing
Find the Open Intervals on which f is Increasing or Decreasing
Find the Open Intervals on which f is Increasing or Decreasing
Find the Open Intervals on which f is Increasing or Decreasing tells us where the function is increasing and decreasing.
Guidelines for Finding Intervals on Which a Function Is Increasing or Decreasing
Using First Derivatives to Find Maximum and Minimum Values and Sketch Graphs • Example 1: Graph the function f given by • and find the relative extremes. • Suppose that we are trying to graph this function but • do not know any calculus. What can we do? We can • plot a few points to determine in which direction the • graph seems to be turning. Let’s pick some x-values • and see what happens.
Using First Derivatives to Find Maximum and Minimum Values and Sketch Graphs • Example 1 (continued):
Using First Derivatives to Find Maximum and Minimum Values and Sketch Graphs • Example 1 (continued): • We can see some features of the graph from the sketch. • Now we will calculate the coordinates of these features • precisely. • 1st find a general expression for the derivative. • 2nd determine where f (x) does not exist or where • f (x) = 0. (Since f (x) is a polynomial, there is no • value where f (x) does not exist. So, the only • possibilities for critical values are where f (x) = 0.)
Using First Derivatives to Find Maximum and Minimum Values and Sketch Graphs • Example 1 (continued): • These two critical values partition the number line into • 3 intervals: A (– ∞, –1), B (–1, 2), and C (2, ∞).
Using First Derivatives to Find Maximum and Minimum Values and Sketch Graphs • Example 1 (continued): • 3rd analyze the sign of f (x) in each interval.
Using First Derivatives to Find Maximum and Minimum Values and Sketch Graphs • Example 1 (concluded): • Therefore, by the First-Derivative Test, • f has a relative maximum at x = –1 given by • Thus, (–1, 19) is a relative maximum. • And f has a relative minimum at x = 2 given by • Thus, (2, –8) is a relative minimum.
Using First Derivatives to Find Maximum and Minimum Values and Sketch Graphs • Example 3: Find the relative extremes for the • Function f (x) given by • Then sketch the graph. • 1st find f (x).
Using First Derivatives to Find Maximum and Minimum Values and Sketch Graphs • Example 3 (continued): • 2nd find where f (x) does not exist or where f (x) = 0. • Note that f (x) does not exist where the denominator • equals 0. Since the denominator equals 0 when x = 2, • x = 2 is a critical value. • f (x) = 0 where the numerator equals 0. Since 2 ≠ 0, • f (x) = 0 has no solution. • Thus, x = 2 is the only critical value.
Using First Derivatives to Find Maximum and Minimum Values and Sketch Graphs • Example 3 (continued): • 3rdx = 2 partitions the number line into 2 intervals: • A (– ∞, 2) and B (2, ∞). So, analyze the signs of f (x) in both intervals.
Using First Derivatives to Find Maximum and Minimum Values and Sketch Graphs • Example 3 (continued): • Therefore, by the First-Derivative Test, • f has a relative minimum at x = 2 given by • Thus, (2, 1) is a relative minimum.
Using First Derivatives to Find Maximum and Minimum Values and Sketch Graphs • Example 3 (concluded): • We use the information obtained to sketch the graph below, plotting other function values as needed.