Download
1 / 42
6.44k likes | 12.67k Vues
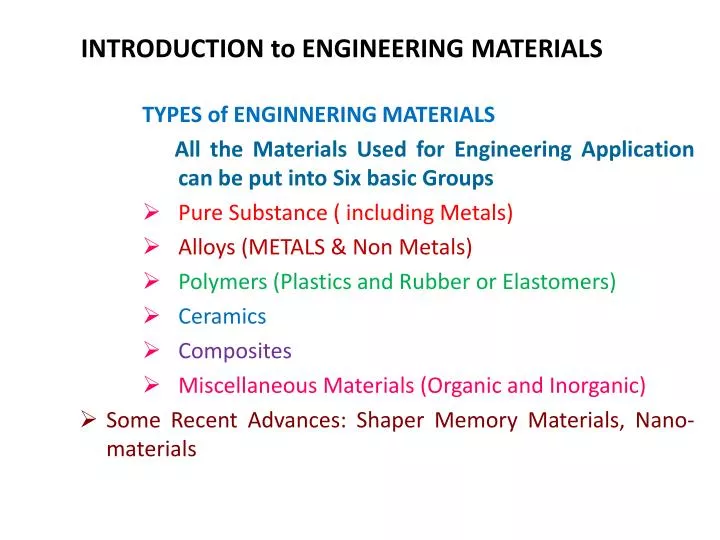
INTRODUCTION to ENGINEERING MATERIALS. TYPES of ENGINNERING MATERIALS All the Materials Used for Engineering Application can be put into Six basic Groups Pure Substance ( including Metals) Alloys (METALS & Non Metals) Polymers (Plastics and Rubber or Elastomers) Ceramics Composites

E N D
INTRODUCTION to ENGINEERING MATERIALS TYPES of ENGINNERING MATERIALS All the Materials Used for Engineering Application can be put into Six basic Groups • Pure Substance ( including Metals) • Alloys (METALS & Non Metals) • Polymers (Plastics and Rubber or Elastomers) • Ceramics • Composites • Miscellaneous Materials (Organic and Inorganic) • Some Recent Advances: Shaper Memory Materials, Nano-materials
Figure 3.1: Some of the Metallic and Non-Metallic MaterialsUsed in a Typical Automobile
Mechanical properties determine a material’s behavior when subjected to mechanical stresses • Properties include Elastic modulus, Ductility, Hardness, and various measures of Strength
Strength: Ability to Bear a Load Before Fracture Ductility:Extent of Permanent or Plastic Deformation that a Material Undergoes Before Fracture. Two Measures of Ductility: % Elongation, % Reduction in Area Elasticity: Ability to Restore to Original Shape and Size after Removal of External Deforming Loads Stiffness: Resistance to ELASTIC (or RECOVERABLE) Deformation .Young’s Modulus is the Measure of Elasticity Hardness: Resistance to PLASTIC (or PERMANENT) Deformation which Includes Indentation, Scratching, or Marking Toughness: Resistance to both ELASTIC and PLASTIC Deformation Fatigue: Permanent Deformation and/or Failure of a Component when Subjected to Fluctuating (Both in Magnitude and Direction) Loads i.e. Gear Teeth, Aircraft Wings, Crankshaft of an Automobile Fracture: Splitting of a Component into at Least Two Halves Creep: Permanent Deformation and/or Failure of a Component when Subjected to High Stresses at High Temperature i.e. Turbine Disk and Blades
Stress‑Strain Relationships • Three types of static stresses to which materials can be subjected: • Tensile - tends to stretch the material • Compressive - tends to contract the material • Shear - tends to cause adjacent portions of material to slide against each other • Stress -strain curve - basic relationship that describes mechanical properties for all three types
Tensile Test Most common test for studying stress‑strain relationship, especially metals In the test, a force pulls the material, elongating it and reducing its diameter Figure 3.1 Tensile test: (a) tensile force applied in (1) and (2) resulting elongation of material
Tensile Test Specimen ASTM (American Society for Testing and Materials) specifies preparation of test specimen Figure 3.1 Tensile test: (b) typical test specimen
Tensile Test Sequence • Figure 3.2 Typical progress of a tensile test: (1) beginning of test, no load; (2) uniform elongation and reduction of cross‑sectional area; (3) continued elongation, maximum load reached; (4) necking begins, load begins to decrease; and (5) fracture. • If pieces are put back together as in (6), final length can be measured.
Engineering Stress • Defined as force divided by original area: where e = engineering stress, F = applied force, and Ao = original area of test specimen
Engineering Strain • Defined at any point in the test as where e = engineering strain; L = length at any point during elongation; and Lo = original gage length
Typical Engineering Stress-Strain Plot Figure 3.3 Typical engineering stress‑strain plot in a tensile test of a metal.
Two Regions of Stress‑Strain Curve • The two regions indicate two distinct forms of behavior: • Elastic region – prior to yielding of the material • Plastic region – after yielding of the material
Elastic Region in Stress‑Strain Curve • Relationship between stress and strain is linear • Material returns to its original length when stress is removed Hooke's Law: e = E e where E = modulus of elasticity • E is a measure of the inherent stiffness of a material • Its value differs for different materials
Yield Point in Stress‑Strain Curve • As stress increases, a point in the linear relationship is finally reached when the material begins to yield • Yield pointY can be identified by the change in slope at the upper end of the linear region • Y = a strength property • Other names for yield point = yield strength, yield stress, and elastic limit
Plastic Region in Stress‑Strain Curve • Yield point marks the beginning of plastic deformation • The stress-strain relationship is no longer guided by Hooke's Law • As load is increased beyond Y, elongation proceeds at a much faster rate than before, causing the slope of the curve to change dramatically
Tensile Strength in Stress‑Strain Curve • Elongation is accompanied by a uniform reduction in cross-sectional area, consistent with maintaining constant volume • Finally, the applied load F reaches a maximum value, and engineering stress at this point is called the tensile strengthTS (ultimate tensile strength) TS =
Ductility in Tensile Test • Ability of a material to plastically strain without fracture • Ductility measure = elongation EL where EL = elongation; Lf = specimen length at fracture; and Lo = original specimen length Lf is measured as the distance between gage marks after two pieces of specimen are put back together
True Stress • Stress value obtained by dividing the instantaneous area into applied load where = true stress; F = force; and A = actual (instantaneous) area resisting the load
True Strain • Provides a more realistic assessment of "instantaneous" elongation per unit length
True Stress-Strain Curve Figure 3.4 ‑ True stress‑strain curve for the previous engineering stress‑strain plot in Figure 3.3.
Strain Hardening in Stress-Strain Curve • Note that true stress increases continuously in the plastic region until necking • It means that the metal is becoming stronger as strain increases This is the property called strain hardening
Compression Test Applies a load that squeezes the ends of a cylindrical specimen between two platens Figure 3.7 Compression test: (a) compression force applied to test piece in (1) and (2) resulting change in height.
Engineering Stress in Compression As the specimen is compressed, its height is reduced and cross‑sectional area is increased e = - where Ao = original area of the specimen
Engineering Strain in Compression Engineering strain is defined Since height is reduced during compression, value of e is negative (the negative sign is usually ignored when expressing compression strain)
Stress-Strain Curve in Compression Shape of plastic region is different from tensile test because cross section increases Calculated value of engineering stress is higher Figure 3.8 Typical engineering stress‑strain curve for a compression test.
Testing of Brittle Materials • Hard brittle materials (e.g., ceramics) possess elasticity but little or no plasticity • Often tested by a bendingtest(also called flexure test) • Specimen of rectangular cross‑section is positioned between two supports, and a load is applied at its center
Bending Test • Figure 3.10 Bending of a rectangular cross‑section results in both tensile and compressive stresses in the material: (1) initial loading; (2) highly stressed and strained specimen; and (3) bent part.
Testing of Brittle Materials • Brittle materials do not flex • They deform elastically until fracture • Failure occurs because tensile strength of outer fibers of specimen are exceeded • Failure type: cleavage - common with ceramics and metals at low temperatures, in which separation rather than slip occurs along certain crystallographic planes
Transverse Rupture Strength • The strength value derived from the bending test: where TRS = transverse rupture strength; F = applied load at fracture; L = length of specimen between supports; and b and t are dimensions of cross-section
Shear Properties • Application of stresses in opposite directions on either side of a thin element Figure 3.11 Shear (a) stress and (b) strain.
Shear Stress and Strain • Shear stressdefined as where F = applied force; and A = area over which deflection occurs. • Shear strain defined as where = deflection element; and b = distance over which deflection occurs
Hardness • Resistance to permanent indentation • Good hardness generally means material is resistant to scratching and wear • Most tooling used in manufacturing must be hard for scratch and wear resistance
Hardness Tests • Commonly used for assessing material properties because they are quick and convenient • Variety of testing methods are appropriate due to differences in hardness among different materials • Most well‑known hardness tests are Brinell and Rockwell • Other test methods are also available, such as Vickers,Knoop, Scleroscope, and durometer
Brinell Hardness Test Widely used for testing metals and nonmetals of low to medium hardness A hard ball is pressed into specimen surface with a load of 500, 1500, or 3000 kg Figure 3.14 Hardness testing methods: (a) Brinell
Brinell Hardness Number Used for metals or non metals of low to medium hardness Hardened steel (or cemented carbide) balls 10 mm dia. ball is pressed into the surface of a specimen using load of 500,1500 or 3000 Kg. Brinell Hardness Number (BHN) = Load divided by indentation area where HB = Brinell Hardness Number (BHN), F = indentation load, kg; Db = diameter of ball, mm, and Di = diameter of indentation, mm
Rockwell Hardness Test • Another widely used test • A cone shaped indenter is pressed into specimen using a minor load of 10 kg, thus seating indenter in material • Then, a major load of 150 kg is applied, causing indenter to penetrate beyond its initial position • Additional penetration distance dis converted into a Rockwell hardness reading by the testing machine
Rockwell Hardness Test Figure 3.14 Hardness testing methods: (b) Rockwell: (1) initial minor load and (2) major load.
Effect of Temperature on Properties Figure 3.15 General effect of temperature on strength and ductility.
Hot Hardness Ability of a material to retain hardness at elevated temperatures Figure 3.16 Hot hardness ‑ typical hardness as a function of temperature for several materials.