Download
1 / 2
20 likes | 129 Vues
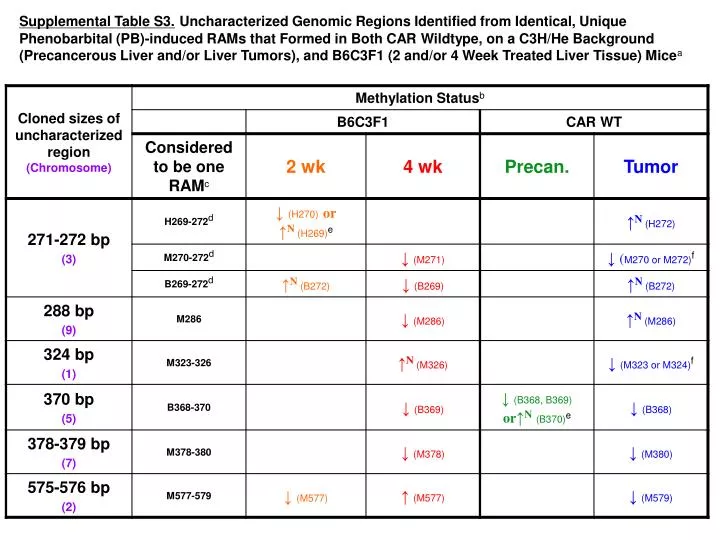
Supplemental Table S3. Uncharacterized Genomic Regions Identified from Identical, Unique Phenobarbital (PB)-induced RAMs that Formed in Both CAR Wildtype, on a C3H/He Background (Precancerous Liver and/or Liver Tumors), and B6C3F1 (2 and/or 4 Week Treated Liver Tissue) Mice a.

E N D
Supplemental Table S3.Uncharacterized Genomic Regions Identified from Identical, Unique Phenobarbital (PB)-induced RAMs that Formed in Both CAR Wildtype, on a C3H/He Background (Precancerous Liver and/or Liver Tumors), and B6C3F1 (2 and/or 4 Week Treated Liver Tissue) Micea
Footnotes – Supplemental Table S3 aIn order to determine whether the methylation patterns of identical uncharacterized genomic regions observed in both studies were altered similarly or differently by PB treatment, unique B6C3F1 RAMs induced by 2 and 4 weeks PB (0.05% (w/w)), and unique RAMs in CAR precancerous and tumor tissue representing these identical regions, were compared. bIncreases in methylation (hypermethylated RAMs: those which are significant, Student’s t-test, p < 0.05, and newly methylated RAMs) are collectively represented by an upwards arrow (↑). A N depicts a new methylation; hypermethylations are upwards arrows which remain unlabeled. Decreases in methylation (hypomethylated RAMs, both 100% decreases, and those which are significant, Student’s t-test, p < 0.05) are collectively represented by a downwards arrow (↓). cA unique RAM (e.g., M286) is listed as a single letter, which indicates the methylation-sensitive restriction enzyme (BssHII, HpaII or MspI) used, plus the size(s), in base pairs, of the unique RAMs detected. If more than 1 size (e.g., H269-272) is listed, these represent the span of the RAM sizes in the B6C3F1 and CAR WT groups, as noted in parentheses in the “methylation status” column. A detailed description of the rationale for considering multiple RAMs of similar sizes to be one RAM is detailed within the Materials/Methods. dSince 3 different restriction digestions were utilized, more than 1 RAM might represent an uncharacterized region. eThe methylation status is ambiguous (e.g., in the B6C3F1 mice at 2 weeks, newly methylated H269 or hypomethylated H270 could represent the 271-272 bp uncharacterized region). fThe uncharacterized region might be represented by 1 of 2 RAMs, which exhibit the same methylation status (e.g., both are decreases).