Download
1 / 64
660 likes | 858 Vues
Technical Analysis and Trading. James Lieow February 2010. Course Objectives. This course aims to bring up to speed individuals who are new to, or only have basic knowledge of, Technical Analysis(TA) or trading

E N D
Technical Analysis and Trading James Lieow February 2010
Course Objectives • This course aims to bring up to speed individuals who are new to, or only have basic knowledge of, Technical Analysis(TA) or trading • At the end of the course, students should be able to use TA to help them start trading, or increase the profitability of their trading
Course Outline • Disclaimer • Why Technical Analysis (TA) • Trade Orders • Chart Types • The Trend • Retracements • Trend Lines, Support & Resistance • Chart Scale • Chart Patterns • Overlays • Indicators • Putting It All Together • Frequently Asked Questions • Final Note
Disclaimer The information, statistical data and opinions contained herein are of the author’s own, and have been obtained from sources which he/she believes to be reliable, but it does not represent that they are accurate or complete, and they should not be relied upon as such. All opinions expressed and data provided herein are subject to change without notice. The securities mentioned in this report may not be suitable for all types of investors. ALL investments involve different degrees of risk. You should be aware of your risk tolerance level and financial situations at all times. Read any and all prospectuses carefully before making any investment decisions. As you know, a recommendation, which you are free to accept or reject, is not a guarantee for the successful performance of an investment and we are expressly prohibited from guaranteeing accounts against losses arising from market conditions. NTU-IIC and its members will not be held liable in any manner for any losses arising directly or indirectly from investment decisions undertaken based on the information/statistical data/opinions expressed.
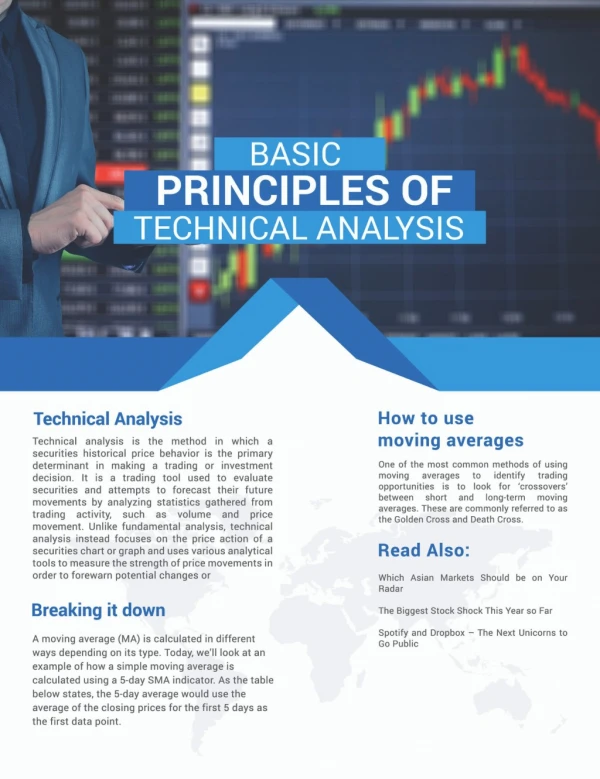
Why Technical Analysis (TA) • You believe that humans are irrational despite most people denying that they are • You believe that we collectively act the same way most of the time, like sheep (or insert animal of your choice) • You believe that charts, for some inexplicable reason, hold the key to the future direction of an instrument’s price (sure you aren’t irrational?) • You believe that the first three points will remain true for a very long time, even as everyone says “This time it’s different!” • TA is versatile – it can be used to analyse price movement of most investable instruments
Trade Orders • Limit buy order • You set the maximum price you are willing to pay • Trade is done when market price is <= the price you set
Trade Orders • Limit sell order • You set the minimum price you are willing to sell at • Trade is done when market price is >= the price you set
Trade Orders • Market buy order • Buy the quantity you want immediately, at the best available price
Trade Orders • Market sell order • Sell the quantity you want immediately, at the best available price
Trade Orders • Buy stop order • Also known as a “stop loss” • Executes a market buy order if price rises above the stop price
Trade Orders • Sell stop order • Also known as a “stop loss” • Executes a market sell order if price falls below the stop price
Trade Orders • Buy stop limit order • Also known as a “stop loss” • Executes a limit buy order at the stop limit price if market price rises above the stop price
Trade Orders • Sell stop limit order • Also known as a “stop loss” • Executes a limit sell order at the stop limit price if market price falls below the stop price
Trade Orders • Buy trailing stop order • Also known as a “stop loss” • Places a limit buy order at a set distance to the market price and lowers it by the trailing step as the market price lowers
Trade Orders • Sell trailing stop order • Also known as a “stop loss” • Places a limit sell order at a set distance to the market price and raises it by the trailing step as the market price rises
Chart Types • Candlestick • Colour represents whether price went up or down • Shows the Open, High, Low, Closing price of the time period
Chart Types • Bar OHLC • Shows the Open, High, Low, Closing price of the time period
Chart Types • Bar HLC • Shows the High, Low, Closing price of the time period
Chart Types • Line Chart • Connects only the closing price of the time periods together
The Trend • How do we identify the trend? • First, select the time period • Observe if swing highs and lows are getting higher or lower • Higher highs, higher lows = Uptrend • Lower highs, lower lows = Downtrend
Retracements • Price does not simply go straight up or down • Often needs to take a breather between large price moves • Often gives people who want to get in/out a chance to • May have a Fibonacci relationship: 38.2%, 50%, 61.8%
Trend Lines • Shows areas of support and resistance • Support – shows an area that prices find hard to fall below • Resistance – shows an area that prices find hard to rise above • How to draw trend lines? • Play connect the dots!
Trend Lines • Notice that price respected the lines? • What happened when the price went below the lower line?
Chart Scale • Arithmetic scale – also known as the normal scale, distance and price scale linearly • Logarithmic or semi-logarithmic scale – distance scales according to percentage change in price • Most of the time it does not matter which scale is used • Changing the scale used may make it easier to fit trend lines
Practice Time • Let’s practice drawing trend lines for the charts in your handouts • Also take this time to go for a break
Chart Patterns • How did chart patterns come about? • Some people saw that often, when price moved a certain way, it would produce a measured move • So we can now leech on their work to predict price movements when we see the patterns that they spotted
Chart Patterns • Double Top • Double Bottom • Triple Top • Triple Bottom • Head & Shoulders • Inverted Head & Shoulders • Ascending Triangle • Descending Triangle • Symmetrical Triangle • Rising Wedge • Falling Wedge • Channels • Bull Flag • Bear Flag • Rounded Top • Rounded Bottom
Practice Time • Let’s practice recognising patterns for the charts in your handouts • Also take this time to go for a break
Overlays • Usually placed on top of price • Can be used to show support or resistance • Can also be used as entry and exit signals • Commonly used: • Moving averages (20/50/200) • Bollinger Bands (20,2.0)