Download
1 / 8
90 likes | 214 Vues
Equations and Graphs. Section 1.4 Page: 21. We use an equation to show that two mathematical expressions are equivalent. Sometimes an equation is an identity , which means that the equation is true for all values of the variable for which the equation is defined. Example of identity:.

E N D
Equations and Graphs Section 1.4 Page: 21
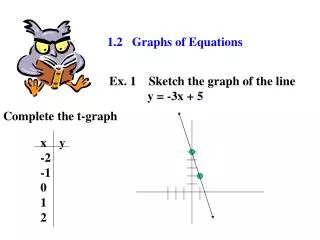
We use an equation to show that two mathematical expressions are equivalent. Sometimes an equation is an identity, which means that the equation is true for all values of the variable for which the equation is defined. Example of identity: More often, equations are conditional equations, which means they only are true for some values of the variable for which the equation is defined. Ex 1: Sketch the graph of 2x + 3y = 6. There are several ways to sketch this graph: • Find coordinates of several points (t-table) • Find the intercepts • Using slope intercept form of a line
y-intercepts: All points of the form (0, y) that satisfy an equation x-intercepts: All points of the form (x, 0) that satisfy an equation. 2x + 3y = 6 y-intercept: 2(0) + 3y = 6 x-intercept: 2x + 3(0) = 6 0 + 3y = 6 2x + 0 = 6 3y = 6 2x = 6 x = 3 y = 2 y (3, 0) (0, 2) x
Ex: Sketch the graph of the equation Solution: Factor the numerator Reduce x + 2 provided that x ≠ 1 This means that the graph of Is the same as x + 2 However, x is not defined at x = 1.
y 4 Undefinded at (1, 3) O 2 x 2 -2 Ex 3: Sketch the following graphs:
Symmetry of a Graph A graph is symmetric to a line when the portion of the graph on one side of the line is a mirror image of the portion on the other side. In the last example, all three are symmetrical. a.) symmetrical with respect to the y-axis b.) symmetrical with respect to the x-axis c.) symmetrical with respect to the x-axis and y-axis (The graph also has point symmetry – the origin)
Coordinate Axis Symmetry of a Graph The graph of an equation has y-axis symmetry if (-x, y) is on the graph whenever (x, y) is on the graph. The graph of an equation has x-axis symmetry if (x, -y) is on the graph whenever (x, y) is on the graph. Previous examples:
Origin Symmetry of a Graph The graph of an equation has origin symmetry if (-x, -y) is on the graph whenever (x, y) is on the graph. Ex 5: Does y = x3 have any symmetry? (-y) = (-x)3 is equal to y = x3 (-y) = (-x)3 -y = -x3 y = x3 Note: If you graph this function, (1, 1) and (-1, -1) are both on the graph which satisfies the definition of origin symmetry. Homework: p. 26; #35-47 all