Download
1 / 9
90 likes | 276 Vues
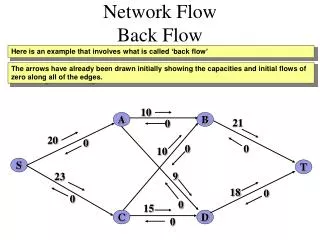
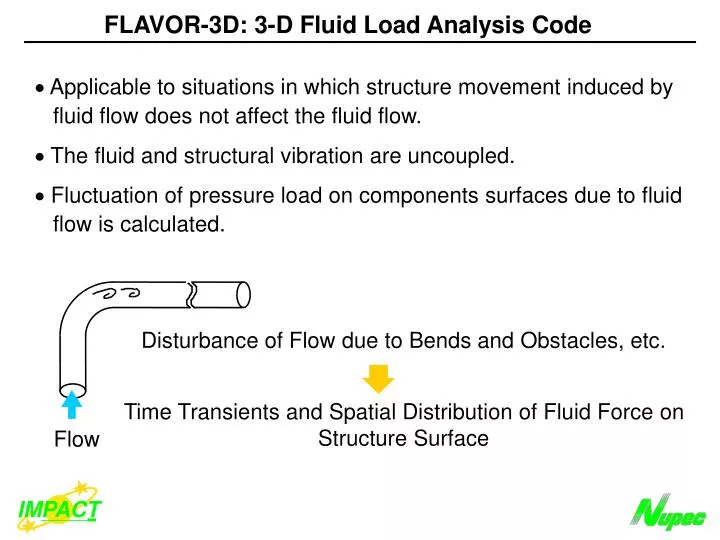
FLAVOR-3D: 3-D Fluid Load Analysis Code. Applicable to situations in which structure movement induced by fluid flow does not affect the fluid flow. The fluid and structural vibration are uncoupled. Fluctuation of pressure load on components surfaces due to fluid

E N D
FLAVOR-3D: 3-D Fluid Load Analysis Code Applicable to situations in which structure movement induced by fluid flow does not affect the fluid flow. The fluid and structural vibration are uncoupled. Fluctuation of pressure load on components surfaces due to fluid flow is calculated. Disturbance of Flow due to Bends and Obstacles, etc. Time Transients and Spatial Distribution of Fluid Force on Structure Surface Flow IMPACT
FLAVOR-3D: 3-D Fluid Load Analysis Code - Application to Pressure Oscillation on PWR Core Barrel - 0.3D Inlet Nozzle D 1.5D Downcomer Analysis Power Spectrum Density 50 kPa 10db Re: 3107 Mesh: 150,000 4-loop PWR measured value 0 20 40 60 2 0 IMPACT 1 Frequency (Hz) Time (s)
FLAVOR-2D: 2-D Fluid-Structure Interaction Analysis Code - Analysis of flow-induced vibration in a single-phase cross flow. - Coupling of fluid flow and dynamic displacement of structure. - Moving boundary in fluid flow analysis by the ALE method. Dynamic structural analysis x(t) x(t+t) Dynamic displacement: x(t) Fluid force: F(t) Moving boundary Flow Fluid dynamics analysis IMPACT
FLAVOR-2D: 2-D Fluid-Structure Interaction Analysis Code - Verification (1) - Outline of Test Vertical cylinder was enforcedly oscillated with frequency f Vortex shedding downstream of the cylinder was measured Fvk : vortex shedding frequency Flow Karman vortex under the condition without oscillation was measured Fk : Karman vortex frequency Forced oscillation frequency f and vortex shedding frequency fvk were normalized by Karman vortex frequency fk IMPACT
FLAVOR-2D: 2-D Fluid-Structure Interaction Analysis Code - Verification (1) Result of a/d=0.1 - 2 3 6 4 (1) Re=490, a/d=0.1 1.2 1.0 Vortex shedding is not affected by oscillation of the cylinder 0.8 fvk/ fk fvk / f = 1 0.6 Vortex shedding coincides with oscillation of the cylinder : “Lock-in” occurs : Test : Analysis 0.5 0.4 0.6 0 0.2 0.4 0.8 1.0 1.2 f / fk f : forced oscillation frequency, fk : Karman vortex frequency, fvk: vortex shedding frequency, a : oscillation amplitude, d : diameter of cylinder. IMPACT
FLAVOR-2D: 2-D Fluid-Structure Interaction Analysis Code - Verification (1) Result of a/d=1.0 - 1.2 (2) Re=490, a/d=1.0 3 6 4 2 fvk / f = 1 1.0 : Test : Analysis 0.8 “Lock-in” phenomena was well reproduced fvk/ fk 0.6 0.5 0.4 1.0 0.2 0.4 1.2 0.6 0.8 0 f / fk f : forced oscillation frequency, fk : Karman vortex frequency, fvk: vortex shedding frequency, a : oscillation amplitude, d : diameter of cylinder. IMPACT
FLAVOR-2D: 2-D Fluid-Structure Interaction Analysis Code - Validation by Analysis of Free Vibration Test- Outline of Test Weight (0.3 lb) Cylinder with Free End Flow The cylinder oscillated due to vortex. Oscillation amplitude was measured. Fixed End IMPACT
FLAVOR-2D: 2-D Fluid-Structure Interaction Analysis Code - Validation Result - 6 Test result* 5 *King, R., et al.: J. Sound and Vibration, 29(2), 169-188 (1973) 4 Amplitude of vibration (mm) 3 Analysis 2 1 0 0.5 2.5 1.0 1.5 2.0 Reduced water velocity IMPACT
FLAVOR-2D: 2-D Fluid-Structure Interaction Analysis Code - Application to ABWR 1/6 Sector Test Analysis - Control Rod Housing Analysis Region Lower Plenum (552 K) 13 m In-core Monitor Housing View A-A’ Calculated stress on the in-core monitor housing : 9 N/mm2 (20% lower than the measurement) A' A Internal Pump (2.12 m3/s, each) IMPACT