Download

1 / 14
140 likes | 262 Vues
Definition and diagnostics for the model-observations comparison. Christina Schnadt Poberaj. Evaluation of multi-model performance (WP 3.1.1) Definition of model simulations: simulations of selected years, comparison of model results with observations in the ETH meg database

E N D
Definition and diagnostics for the model-observations comparison Christina Schnadt Poberaj
Evaluation of multi-model performance (WP 3.1.1) Definition of model simulations: simulations of selected years, comparison of model results with observations in the ETHmeg database Diagnostics of key processes relevant for the effects of the different modes of transportations: stratosphere-troposphere exchange of O3 and NOx boundary layer venting convective transport of pollutants emitted at the surface
Evaluation of multi-model performance Definition of model simulations: simulations of selected years, comparison of model results with observations in the ETHmeg database Model evaluation: year 2003 Campaign data to be used: SPURT, UTOPOHIAN_Act, MOZAIC, CONTRACE, VINTERSOL, INTEX, SCIAMACHY NO2 columns
Evaluation of multi-model performance Boundary conditions for 2003 runs: Model will be run in the same set-up as in the current impact study (WP3.1.2) Anthropogenic emissions year 2000: EDGAR 3.2 Fast Track 2000 GHGs CO2, CH4, N2O, and F-gases (HFCs, PFCs, and SF6) air pollutants CO, NMVOC, NOx, SO2 Large-scale biomass burning: annual burned area estimates for 1997-2000 average, or actual 2000 area, or EDGAR 3.2 emission factors, or factors compiled by Andreae and Merlet (2001) Biogenic NO, isoprene, and monoterpene emissions soon available by MPI for chemistry Lightning NOx: 5 Tg (N)/yr Transport emissions: from Activity 1 if available (report by Peter) otherwise road traffic (Volker), air traffic (AERO2K or DLR1992), shipping emissions (via UiO, Endresen)
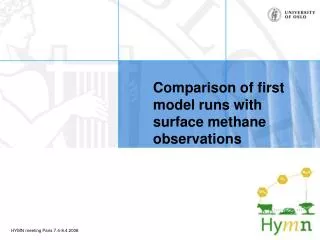
Fundamental evaluation of model performance Comparison with observations: Comparison of observed and modelled tropospheric ozone and CO (O3 at various altitudes, surface O3, CO) Time series Model biases Correlations Skill scores Model-model intercomparisons: Intercomparisons between models: zonal means and horizontal distributions of relevant species (O3, CO, CH4, NO2, (NOx), CH2O, HNO3, OH, SO2, H2SO4)
Model evaluation of RETRO 1997 test simulations using ozonesonde station data (left) and CMDL stations data for surface ozone and CO (right)
Brunner et al. (2005)
Model biases at individual ozonesonde stations or airports (MOZAIC airport profiles) Identify model biases: Scatterplots O3, NOx, CO, … TM4, RETRO project 1997 quasi-monthly means (dates where ozonesonde data available only)
Brunner et al. (2003)
Testing the skill of the models: Taylor diagrams • correlation coefficient, • pattern root-mean square (RMS) error, • ratio of modelled/observed standard • deviation • all indicated by a single point • Example C1 • correlation 0.52 • normalized standard deviation 1.2 • RMS error proportional to linear distance between Ref. and C1 • skill score 0.60
Diagnostics of key processes Troposphere-stratosphere mixing: CO-O3 correlation Boundary layer venting: analyse vertical tracer profiles (radon, CH3I) Stratosphere-troposphere exchange: ideas? Convective transport: ideas?
Identify troposphere-to-stratosphere transport: O3-CO correlations From Hoor et al. (JGR, 2002)
MOZAIC, SPURT data: tropopause information (ERA40) interpolated onto flight tracks available • (dynamical tropopause (PV2), potential temperature at dyn. tropopause, pressure at dyn. tropopause) • analysis relative to tropopause possible • additional model output recommended: PV2 tropopause, pressure, pot. temperature at dyn. tropopause, PV at flight coordinates Tropopause routine by D. Brunner and timepos files will be provided by end of year 2005.
Planned schedule • Extension of database for the year 2003 completed: • by end of year 2005 • Extension of database finished: end of January 2006 • Validation of 2003 simulations: start in September 2006