Download
1 / 24
240 likes | 370 Vues
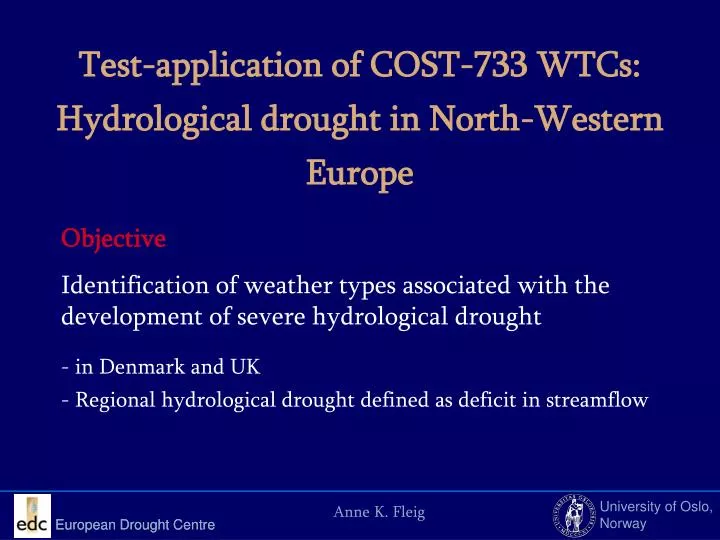
Test-application of COST-733 WTCs: Hydrological drought in North-Western Europe. Objective Identification of weather types associated with the development of severe hydrological drought - in Denmark and UK - Regional hydrological drought defined as deficit in streamflow.

E N D
Test-application of COST-733 WTCs: Hydrological drought in North-Western Europe Objective Identification of weather types associated with the development of severe hydrological drought - in Denmark and UK - Regional hydrological drought defined as deficit in streamflow European Drought Centre
Hydrological drought Data: • 38 streamflow stations from Great Britain • 23 streamflow station in Denmark • daily data • natural or naturalized • at least 30 years of data • common standard period: 1964 – 2003 Drought definition • For each station: threshold level method (Qtr=90-percentile) • Identification of regions with “homogeneous” drought occurrence Regional drought series
Hydrological drought: “Homogenous” regions Great Britain Denmark
Hydrological drought: Regional drought index Index definition • Daily series • Percentage of stations experiencing drought weighted by catchment area • “drought affected proportion of area within one region” RDI: 0 - 1 Regional drought definition • RDI > 0.7 • Seasonal series: number of drought days per summer (summer season: 16 Apr – 15 Oct )
Hydrological drought: Regional drought index Index definition • Daily series • Percentage of stations experiencing drought weighted by catchment area • “drought affected proportion of area within one region” RDI: 0 - 1 Regional drought definition • RDI > 0.7 • Seasonal series: number of drought days per summer (summer season: 16 Apr – 15 Oct )
Hydrological droughts: Regional series RDI > 0 RDI > 0.4 RDI > 0.7
Selection of Weather Type Classifications Differences in: • methods: PCA, cluster analysis, etc; • input data: MSLP, Z500, etc; • number of types; • similarity index.
Selection of Weather Type Classifications Differences in: • methods: PCA, cluster analysis, etc; • input data: MSLP, Z500, etc; • number of types; • similarity index. • First choices for domain 00: OGWL, SANDRA, TPCAV, TPCA07, PCACA, EZ500C30, EZ500C10
WTs associated with hydrological drought • Identify WTs which are more frequent during droughts and periods leading up to severe drought events Daily series - first 20 days of the 8 most severe events (= longest droughts) Seasonal series - 3 summers with most drought days - preceding winters
WTs associated with hydrological drought Frequency anomaly (FA) • Fds = Frequency during drought period (1 year) • Fn = Frequency during that period of the year (1964 – 2001) FA = (Fds - μFn) / σFn
WTs related to severe hydrological droughts • different WTs seem to be related with drought • WTs can have a high positive FA for one event and negative FA for other events • also for WTCs with only few different types
Comparison of identified WTs with composites • mean FA is positive or negative for summer / winter / event / summer and event
Comparison of identified WTs with composites Do WTs with high precipitation have positive mean FA? • TPCA07: no. • TPCAV: a few times for the summer series. • SANDRA: yes, but only once among the first five WTs; more often for summer series. • OGWL: yes, sometimes; more often for summer series.
Correlation analysis for seasonal series Groups of WTs: • positive mean FA over all summers • positive mean FA over all events • positive mean FA over all summers with maximum • positive mean FA over all events with maximum • negative mean FA over all summers • negative mean FA over all events • subjective selection based on composites: positive • subjective selection based on composites: negative
Correlation analysis for seasonal series Results: • highest correlation with group: positive mean FA over all summers • WTCs with highest correlation:OGWL and SANDRA • general low R2
Further work • correlation analysis between daily RDI-series and WT-frequencies during the 30 / 60 / 90 and 180 last days • chose WTC for domain 04 and drought from Great Britain
Conclusions • selection method works better for TPCAV and TPCA07 • problematic when few types dominate too much (SANDRA) • but highest correlation with OGWL and SANDRA • disadvantage of TPCAV and TPCA07:same WT has contrasting effects during summer and winter
Conclusions • selection method works better for TPCAV and TPCA07 • problematic when few types dominate too much (SANDRA) • but highest correlation with OGWL and SANDRA • disadvantage of TPCAV and TPCA07:same WT has contrasting effects during summer and winter WTC based on other input data (total water column) ?