Download
1 / 81
830 likes | 1.01k Vues
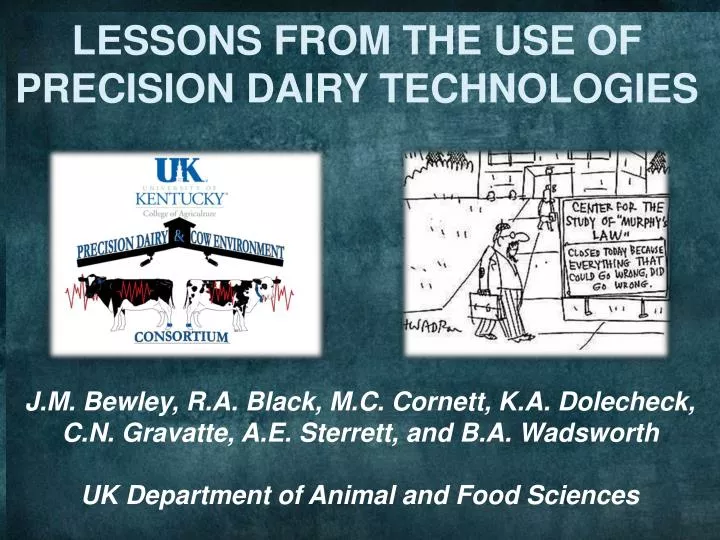
LESSONS FROM THE USE OF PRECISION DAIRY TECHNOLOGIES. J.M. Bewley, R.A. Black, M.C. Cornett, K.A. Dolecheck, C.N. Gravatte, A.E. Sterrett, and B.A. Wadsworth UK Department of Animal and Food Sciences. Sometimes When You’re Sitting on the Cutting Edge, It Hurts your Butt. Dr. Mike Schutz.

E N D
LESSONS FROM THE USE OF PRECISION DAIRY TECHNOLOGIES J.M. Bewley, R.A. Black, M.C. Cornett, K.A. Dolecheck, C.N. Gravatte, A.E. Sterrett, and B.A. Wadsworth UK Department of Animal and Food Sciences
Sometimes When You’re Sitting on the Cutting Edge, It Hurts your Butt Dr. Mike Schutz
Technology Pitfalls • “Plug and play,” “Plug and pray,” or “Plug and pay” • Technologies go to market too quickly • not fully-developed • software not user-friendly • Developed independently without consideration of integration with other technologies and farmer work patterns • Too many single measurement systems
Technology Pitfalls Lack of large-scale commercial field trials and demonstrations Technology marketed without adequate interpretation of biological significance of data Information provided with no clear action plan Just simple information overload
Be prepared for little things to go wrong Be careful with early stage technologies Need a few months to learn how to use data Data integration is challenging
Be cautious without sensitivity/specificity data Algorithms make a difference Use according to manufacturer directions Customer service matters
Outline Temperature Monitoring Body Condition Scoring Lying Behavior Real Time Location Tracking Precision Project
Reticulorumen Temperatures TenXsys SmartBolus DVM Systems/MaGiiX
Milking Parlor MaGiiX Panel 1 Rectal Temps GLA Thermometer Holding Pen Scale MaGiix Panel 2 (installed for fall, winter)
LSMeans for Milking P<0.0001 for all differences
Considerable variation in both rectal and reticular temperatures Reticular temperatures higher than rectal temperatures Rectal and reticular temperatures are moderately correlated Correlation appears to be lower during colder temperatures Correlation appears to be higher at night
Impact of water intake on dairy cattle reticulorumen temperature Cornett et al. 2011 • Examine the relationship between water intake and reticulorumen temperatures collected with SmartBolus® Transponders (TenXsys, Eagle ID): • Water temperature • Water volume • Time to return to baseline
Ad Lib Water Study • University of Kentucky Coldstream Dairy Tie-Stall Barn • 4 mid-lactation, multiparous, Holstein cows • SmartBolus® Transponders recording at 2 minute intervals • Drinking behavior monitoring: • Two observers per 4 hour shift • 48 consecutive hours
Drinking behavior of cows housed in tie-stall barns is characterized by frequent but small drinking bouts • Even small quantities of water consumed influence reticulorumen temperatures • With free-choice access to water in a tie-stall facility in the winter, reticulorumen temperature returns to normal in about an hour
Controlled Water Intake Study • Twelve multiparous, mid-lactation, Holstein cows • SmartBolus® transponders recording at two minute intervals four consecutive days • Modified Latin square design (random cow assignment) • Three water quantities: 5.7 L, 11.4 L, 22.7 L • Four water temperatures: 1.7°C, 7.2°C, 15.6°C, 29.4°C • No cow received the same temperature treatment twice
Controlled Water Intake Study • Feed and water intake restricted from 8:00 am to 3:30 pm • Water drenched to each cow via Cattle Pump System® (Springer Magrath, Mcook, NE) • Each cow’s baseline temperature was calculated from the mean temperature of the 48 hours before experiment • Two 95% confidence intervals (CI) were calculated using the SD for this time period • Time to return to baseline was calculated as the first recorded temperature within the 95% CI after water drenching
Time to Baseline Time to Return to Baseline = 2.63 + (23.59×Water Quantity) + (0.03 × Water Temperature °F) - (0.23 × (Water Quantity × Water Temperature))
Temperature Drop Temperature Drop = 7.59 + (2.85×Water Quantity) - (0.08 × Water Temperature °F) - (0.02 × (Water Quantity × Water Temperature))
As water quantity increased, average time to return to baseline temperature increased (up to 67 ± 38 minutes) • As water temperature decreased, time to return to baseline temperature increased (up to 63 ± 42 minutes) • Impact of water intake on reticulorumen temperatures is considerable and impacted by both quantity and temperature of water consumed
Detection of Clinical and Subclinical Mastitis • DVM Systems, LLC (Boulder, CO) reticulorumen bolus monitoring system (Phase IV Engineering Inc., Boulder, CO) • Temperatures collected twice-daily from 110 cows, including 71 Holstein cows, 22 crossbred cows, and 17 Jersey cows from September 15, 2011 to June 28, 2012 • A composite milk sample was obtained from each cow in the herd every 14 days for SCC analysis • Subclinical mastitis events were established when SCC was greater than 200,000 cells/mL Sterrett et al., 2012
Detection of Clinical and Subclinical Mastitis • Milkers recorded clinical mastitis events if a cow’s milk was abnormal • Reticulorumen temperatures were adjusted for the change in herd temperature at each milking • A 30-day rolling mean baseline reticulorumen temperature was calculated along with the number of SD from which each respective reticulorumen temperature varied from this baseline • The maximum reticulorumen temperature and number of SD among all reticulorumen temperatures within the previous 2 days were used as a baseline to assess whether a reticulorumen temperature alert was observed for clinical and subclinical mastitis events
Descriptive statistics for observed temperatures associated with mastitis events
Example of mastitis event with temperature threshold reached before a subclinical mastitis event
Example of mastitis event with temperature threshold reached before a subclinical mastitis event
Natural variation in cow body temperatures may limit the utility of a reticular-based temperature monitoring system with twice-daily recordings. • More frequent or continuous temperature recording may be necessary to unlock the full potential of dairy cattle temperature monitoring • Different bacteria species may have varying effects on temperature
Influence of breed, milk production, season, and ambient temperature on reticulorumen temperature Reticulorumen temperatures (RT) were recorded every 15 minutes using SmartBolus® transponders (TenXSys Inc., Eagle, ID) for 97 cows (67 Holstein, 20 crossbred, and 10 Jersey) at the University of Kentucky Coldstream Dairy from November 06, 2009 to July 14, 2011 Raw RT (n=1,646,145) were edited to remove erroneous reads and temperatures potentially influenced by water intake by removing temperatures (1) < 38.3°C and (2) < 3 SD from each individual cow’s 28 days rolling RT average 14426 cow days were included in the final model Liang et al., 2012
Reticulorumen and Ambient Temperatures within Day The nadir and zenith RT appeared 10:00 and 23:30, respectively.
Relationship between daily ambient temperature and daily reticulorumen temperature
Relationship among daily ambient temperature, daily milk production and daily reticulorumen temperature
Reticulorumen temperatures are impacted by ambient temperature, milk production level, breed, and parity • Crossbred cows may be more heat tolerant than Holstein cows, even after accounting for differences in milk yield • These results provide new insight into cow core body temperature and may be useful in interpreting data from automatic temperature monitoring systems
Automated Body Condition Scoring Reduced labor requirements Less stressful on animal More objective, consistent measure Increased observation frequency Early identification of sick animals Tracking BCS trends of individual animals and management cohorts
Image Collection Weigh Station Camera • Images collected with a digital camera • Camera triggered to capture image when gates closed • Image timestamps matched with weigh station timestamps to ID cows • Images only available during afternoon milking because of lighting
Predicted vs. Actual USBCS • 100% of predicted BCS were within 0.50 points of actual BCS. • 93% were within 0.25 points of actual BCS.
BCS through imaging is possible • Lighting is important • Image extraction is most difficult part • Funding is next most difficult part
Lying is a high priority for dairy cows. (Munksgaard, 2005) • Cows require 12-14 hours of lying time/day. (Grant, 2007) • Providing cows time to rest may increase milk production
IceTags • The IceTag™ from IceRobotics (Scotland) uses accelerometer technology to monitor: • Lying • Standing • Stepping behavior • Validated by comparison with direct visual observations • ( McGowan et al., 2007, Munksgaard et al., 2006)