Download
1 / 18
260 likes | 492 Vues
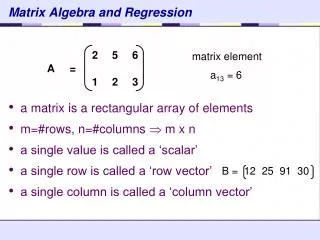
Linear algebra and regression. Solving linear equations. The simplest system of linear equations has two equations and two variables , for example: This system can be represented using matrices and vectors in the form Ax = b. Solving linear equations.

E N D
Solving linear equations • The simplest system of linear equations has two equations and two variables, for example: • This system can be represented using matrices and vectors in the form Ax = b
Solving linear equations • Solving this system in Matlab is straightforward: octave:9> A = [1 -1 ; 3 1] A = 1 -1 3 1 octave:10> b = [-1 ; 9] b = -1 9 octave:11> x = A\b x = 2 3
Solving linear equations • We can now verify that x1 = 2, x2 = 3 is a solution by calculating Ax octave:12> A*x ans = -1 9 octave:13> A*x-b ans = 0 0
Exercise • Solve the following linear system: 2x – 3y = 3 4x – 5y + z = 7 2x -y -3z = 5
Determinants octave:15> det(A) ans = 4 octave:16> A(1,1)*A(2,2)-A(1,2)*A(2,1) ans = 4
Linear independence • Consider the following system: • The determinant of this matrix is zero. (check this in octave)
Linear independence and rank • The rank of a matrix is simply the number of rows which are not linearly dependent, or linearly independent rows. • It can be shown that the rank with respect to rows is equal to the rank with respect to columns, i.e. the rank of a matrix is also equal to the number of linearly independent columns. • In Matlab we can use the rank() function to compute the rank.
Underdetermined vs overdetermined systems • The matrix A can have dimension m×n with m≠n. • If m < n then there are more variables than equations. Here it will usually be impossible to find an unique exact solution. This is an underdetermined system. • If m > n then there are more equations than variables. It may be impossible to satisfy all equations simultaneously. This is an overdetermined system.
Least squares and Linear regression • When you use the Matlab backslash operator in the context of an overdetermined system it automatically returns a least squares solution. • This feature can be used for linear regression. For example, if we want to find the best fit line through a set of points (x1, y1), (x2, y2), ..., (xm, ym) then one of the simplest forms of regression we can come up with involves a single estimate (β) for the slope of a line. • We redefine the problem as finding the beta values that minimize the sum of square differences:
Exercise • Download the incomplete script “simpleReg.m” and finish it by implementing the function S(x,y,beta). The output should be:
Linear regression • We can define this in matrix form too. Here, • where X is a matrix with Xi1 = 1 and Xi2 = xi , i.e. a column of ones followed by the column x.
Linear regression Within Matlab, we simply write this as an overdetermined system Xβ = y to obtain our parameter estimates by least squares. • Matlab performs the minimization itself. This is the simple linear regression.
Exercise Start by loading the file agevbp.txt from the course site. These are data comparing age (1st column) vs systolic blood pressure. • Plot age (x-axis) vs blood pressure (y-axis) • Build the two-column matrix X as defined above. • Solve Xβ = y • Add the regression line to the plot
Quadratic regression We then solve Xβ = y as before
Exercises • Download the file “qdata.txt” of x,y pairs and perform a quadratic regression. Plot the data and the regression curve. • For the following data: Perform an exponential regression using the model: