Download
1 / 27
270 likes | 300 Vues
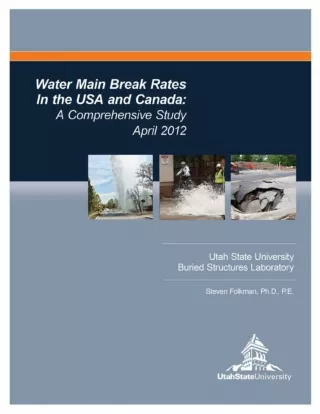
Water Main Break Rates In the USA and Canada: A Comprehensive Study Utah State University Buried Structures Laboratory. Corrosion major cause of water main breaks. PVC pipe has lowest failure rate.

E N D
ExEcutivESummary Modern societies base their economic prosperity on a standard of living which includes a complex network of infrastructure,bothaboveandbelowground.Qualitydrinkingwaterbroughttothetapthroughelaborateunderground distribution systems is a critical component to our public health and economic well-being. In the USA and Canada, it has been the hallmark of our industry andcooperation. EvidEnCE ofdEClinE Our water infrastructure is now in decline after decades of service. The signs of distress surface daily as water mains break, creating floods and sink holes. The loss of water service is more than an inconvenience, since it causes significant social and economic disruptions and jeopardizes publichealth. ThEMEASUREMEnT One factor used to quantify the occurrences of failing underground pipe networksiswatermainbreakrates.Watermainbreakratesarecalculated forallpipematerialsusedinthetransportofwatertocreateameasurement to judge pipe performance and durability. Water main break rates can vary year to year and by utility. However, in aggregate, break rates produce a compelling story which can aid our prudent decision making as it relates to repairing and replacing our undergroundpipes. PURPoSE AndhighlighTS ThisComprehensiveWaterMainBreakRateStudyfortheUSAandCanada compiles the collective experience of 188 utilities which can be used for making future critical pipe replacement decisions. It is the desire of the researchersandparticipantstoofferdataandanalysisthatutilitymanagers andelectedofficialscanapplytothecircumstancesoftheirownoperations. Highlights of the Comprehensive Water Main Break Study includea new national metric for citizens served per one mile of pipe, aggregate data on pipe material break rates, analysis of age and corrosion in failure modes, and related observations on pressure, temperature and trenchless technology practices. introduction In the United States and Canada, underground water infrastructure was installed during three main time periods becauseofthepopulationgrowthinthe1800s,1900–1945,andpost1945.Pipesconstructedineachofthesethree eras will all start to fail at nearly the same time over the next couple of decades for a number of reasons ranging from age and corrosion to inadequate design and poor installation. Additionally, the life span of the materials used hasbecomeshorterwitheachnewinvestmentcycle(WIN,2002).In2009,theAmericanSocietyofCivilEngineers issued a USA Infrastructure Report Card and gave a D- to drinking water and wastewater infrastructure (ASCE, 2009). In 2001, an AWWA study called “Dawn of Replacement” pointed out: The oldest cast iron pipes—dating to the late1800s—have an average useful life of about 120 years. This means that, as a group, these pipes will last anywherefrom90to150yearsbeforetheyneedtobereplaced,butonaveragetheyneedtobereplacedafterthey have been in the ground about 120 years. Because manufacturing techniques and materials changed, the roaring ’20s vintage of cast-iron pipes has an average life of about 100 years. And because techniques and materials continued to evolve, pipes laid down in the Post-World War II boom have an average life of 75 years, more or less. Using these average life estimates and counting the years since the original installations shows that these water utilities will face significant needs for pipe replacement over the next few decades. Replacement of pipes installed from the late1800s to the 1950s is now hard upon us, and replacement of pipes installed in the latter half of the 20th Century will dominate the remainder of the 21st. We believe that we stand today at the dawn of a new era— the replacement era—for water utilities. (AWWA, 2001) In an update to the “Dawn of Replacement”, AWWA has published “Buried No Longer” which states, “More than a million miles of pipes are nearing the end of its useful life andapproachingtheageatwhichitneedstobereplaced.”(AWWA2012)Thesereplacementcostscombinedwith projected expansion costs will cost more than $1 trillion over the next couple ofdecades. Water Main Break Rates in the USA and Canada: A ComprehensiveStudy April 2012 Utah State University Buried Structures Laboratory | Steven Folkman, Ph.D.,P.E. 3
Over 54,000 community water systems face the inevitable cost of pipe repair and replacement. The United States EPA states that nearly 60% of the total system costs are found in the distribution and transmission pipe lines. Infrastructure asset management is an approach which can help utilities bring together the concepts, tools, and techniquestomanageassetsatanacceptableservicelevelatthelowestlife-cyclecost.Assetmanagementpractices applied to underground infrastructure help utilities understand the timing and costs associated with replacement activities.Theknowledgegainedfromtheseeffortsalsohelpsinthedevelopmentofpipematerialselectioncriteria as part of the replacement strategies and fundingplans. • Aging WATERinfRASTRUCTURE • The EPA’s Aging Water Infrastructure research program (http://www.epa.gov/awi/) is working toward the goal of making our nation’s water infrastructure sustainable by supporting research and by promoting strategic asset management. This comprehensive water main break study is part of the continuing credible, analysis-based effort to support the EPA’s program goalsincluding: • Reduced life-cycle costs for water infrastructuremanagement • Extended service life of existinginfrastructure • Reduced high-risk water main breaks • Improved condition assessment and decision- makingcapabilities • Reduced potable water leakage and intrusionpotential • Increased use of performance and cost data for decision support, and the adoption of assetmanagement • Increased adoption of innovativetechnologies • The water industry has seen many types of academic surveys and studies on water main replacement programs and the benefits of asset management and prioritization. However, many utilities have not historically tracked all of the elements of water main break data. As this trend changes, more data and analysis will be available to the industry to improve water distribution system repair and replacement decision making. This comprehensive report basedonstatisticallysignificantexperiencesfrom188utilitiesalsodrawsfromotherrelevantstudiestobethemost complete study on water main breakdata. • ThE PRiMARyRESEARChER • Dr. StevenFolkmanisaregisteredProfessionalEngineer,amemberofAmericanSocietyforTestingandMaterials (ASTM) F17 Plastic Piping Systems, a member of AWWA and a member of the Transportation Research Board CommitteeonCulvertsandHydraulicStructures,andhasoversightoftheprestigiousUtahStateUniversity’s(USU) Buried Structures Laboratory. The Buried Structures Laboratory at USU has been involved in analysis and testing of all kinds of pipe and associated structures for over 50 years. Previous directors include Dr. Reynold Watkins and Dr. Al Moser who are internationally recognized experts. Dr. Moser and Dr. Folkman are coauthors of the widely used text, Buried Pipe Design (Mc Graw Hill, 3rd Edition). Dr. Folkman’s research assistant for this project was Ammon Sorensen. Dr. Folkman’s expertise includes structural dynamics, linear and nonlinear finite element analysisutilizingsoil/structureinteraction,andtesting.TheUSUBuriedStructuresLaboratoryisrecognizedasone oftwolaboratoriesintheUnitedStatesforperforminglargescaletestsonburiedpipes.Itisfromthisexpertiseand background that the surveys of water main breaks were developed and analyzed to complete this comprehensive study. 4 Water Main Break Rates in the USA and Canada: AComprehensive Study April 2012 Utah State University Buried Structures Laboratory | Steven Folkman, Ph.D.,P.E.
ThEMEThodology • During 2011, Utah State University conducted a study of utilities across the USA and Canada to obtain data on water main failures of municipal and private water supply systems. The study was comprised of two parts: a basic survey and a more detailed survey. The focus of the basic survey was to examine the number of failures utilities were experiencing and how those failures related to the pipe materials used. This effort focused on water supply mains (sewer and force main pipes were excluded). A variety of pipe materials are used in water supply systems and over the past 100 years the materials have evolved with different manufacturing technologies. As a result, pipe performance has changed. A goal of the more detailed level of analysis was to look at which materials were performing best at a snapshot in time and to track how pipe age affects failurerates. • A total of 1,051 surveys were mailed out to USA and Canadian water utilities in May and June of 2011. The participantswereaskedfordatafromaprevious12monthtimeperiodandthustheresultsrepresentatimeperiod that mostly coincides with the year 2010. A total of 188 utilities responded and completed the basic survey with 47 ofthesealsorespondingtothedetailedsurvey.117,603milesofpipearerepresentedinthiscomprehensivestudy. The USA and Canada were divided into nine regions and the 188 survey respondents were categorized according to the region and the size of the utility based on amount of pipe. This comprehensive study documents the results from both surveys and draws from other relevant industrysources. • oBjECTivESAndgoAlSofThESTUdy • There were many objectives of the surveys. These objectivesinclude: • Understanding the age and pipe size distribution of pipe in the respondent’s system • Reviewing delivery and fluctuations of waterpressure • Itemizing pipe failures over a time period with the data broken down by materialtype • Identifying the most common pipe failure modes and materials as identified by theutility • Determining whether corrosive soils are present and whether corrosion prevention methods wereused • Highlighting pipe replacement plans, expected pipe life of new pipe and leak detectionmethods • Considering contractor selection based on contractor experience and which pipe materials areallowed • Quantifying experience with pipe relining, pipe bursting, and directional drilling to examine future directions of pipe repair andinstallation. Water Main Break Rates in the USA and Canada: A ComprehensiveStudy April 2012 Utah State University Buried Structures Laboratory | Steven Folkman, Ph.D.,P.E. 5
MAjoRfindingS The comprehensive nature of this study has provided several national-level metrics and rules of thumb which utilities can use for benchmarkingpurposes. This Survey Achieved WideParticipation A total of 117,603 miles of pipe were reported by the 188 survey participants. This represents approximately 10%ofthetotallengthofwatermainsintheUSA.Thisisoneofthelargestsurveysconductedonwatermains failures and the results give an accurate representation water main behavior in the USA andCanada. nationwide one Mile of installed Water Main Serves 264People While in urban areas the industry has assumed 325 people are served for 1 mile of distribution system pipe, this survey suggests a new national metric of 264 people served per 1 mile of pipe regardless of utility size. Also, 66% of all water mains are 8” or less in diameter and the range of 10” to 14” make up another 18% of all installed watermains. Most Utilities Use Several Kinds of PipeMaterials 80%oftheinstalledwatermainsutilizeacombinationofCastIron(CI)at28%,DuctileIron(DI)at28%andPVC pipe at 23%. This fact is supported by a relative low amount (13%) of utilities which avoid DI due to corrosion concerns. Pipe Material Use differs byRegion Water main pipe material usage varies significantly over geographic regions (see Figure 9). The Northeast and North Central region of the USA (Regions 6 and 8 as illustrated in Figure 1) uses either CI or DI pipe for approximately 90% of its length. In Region 9, Canada, PVC pipe makes up 43% of thetotal. There is Considerable Scatter in Pipe failure Ratedata Thewatermainbreakexperiencesofoneutilitymaynotrepresentanother.Factorssuchasclimate,installation practices,andsoilcorrosivitycangreatlyaffectfailurerates.Everyutilityshouldproperlyinstallpipe-regardless ofmaterial.Inordertohaveanaccuratewatermainbreaksurvey,alargenumberofrespondentsarerequired. PvC Pipe has the lowest overall failureRate WhenfailuresratesofCastIron,DuctileIron,PVC,Concrete,Steel,andAsbestosCementpipeswerecompared, PVC is shown to have the lowest overall failurerate. Corrosion is a Major Cause of Water Main Breaks 75% of all utilities have corrosive soil conditions and combined with a high portion of CI and DI pipes, one in fourmainbreaksiscausedbycorrosionwhichisrankedthesecondhighestreasonforwatermainpipefailure. Northeast and North Central USA utilities (Region 6 and 8) will experience a higher percentage of corrosion breaks due to a higher concentration of CI and DI pipes (90%)installed. The Average Age of failing Water Mains is 47 yearsold 43% of water mains are between 20 and 50 years old and 22% of all mains are over 50 years old. While pipe lifecanbeestimatedatover100years,actuallifeisaffectedbysoilcorrosivityandinstallationpractices.Based onthedetailedsurvey,theaverageexpectedlifeofpipebeingputinthegroundtodayis79years.Forexample, non-corrosive materials like PVC have an estimated life over 110 years (Burn, 2006). Regardless of the pipe material selected, installation practices will affect the actual life that can beachieved. The Average Supply Pressure is 77 psi with Pressure fluctuations less than 20psi. Pressure events can contribute to water main breaks for pipes that have internal corrosion (tuberculation) or weakened areas due to external corrosion. Pressure is an important component to pipe design and material selection. A well-controlled system operated below design limits will lead to extended pipelife. The Use of Trenchless Technologies will continue toincrease While 57% of utilities use some form of leak detection, fewer utilities have engaged in trenchless technologies likepiperelining,pipeburstinganddirectionaldrilling.Over40%areconsideringpipereliningandpipebursting in the future. Directional drilling is more widely accepted and has a higher satisfaction rating and as a result, 74% of utilities are considering it in thefuture. over 8% of installed Water Mains are Beyond Their Usefullife This figure corresponds well with an EPA study (EPA, 2002) that shows the amount of pipe needing immediate replacementisgrowingrapidly.Improvedassetmanagementwillbeessentialtoallutilitiestosurvivethistrend. 6 Water Main Break Rates in the USA and Canada: AComprehensive Study April 2012 Utah State University Buried Structures Laboratory | Steven Folkman, Ph.D.,P.E.
SURvEyREgionS Intotal,188utilitiesparticipatedinthesurveysandarerepresentativeoftheninesurveyregionsintheUnited States andCanada. figure 1. Regions used to report surveyresults. Theregionsdefinedinthestudyareusedheretoindicatethewidegeographicaldistributionoftherespondents. Table 1 lists the number of respondents in the basic and detailed surveys from each region, and Figure 1 illustrates the locations of the nine different regions used in this report. The provinces in Canada with a white color did not have respondents to the survey. Figure 2 illustrates the miles of water main pipe that were reported in the basic survey on a regional basis. Similarly, Figure 3 illustrates the miles of water main pipe on a regional basis from the detailed survey. A total of 32,130 miles of pipe was reported by respondents in the detailed survey. It is noted that the respondents were distributed across a large survey area, but this study is still more comprehensive than other studies todate. Table 1. number of Survey Respondents by region. Water Main Break Rates in the USA and Canada: A ComprehensiveStudy April 2012 Utah State University Buried Structures Laboratory | Steven Folkman, Ph.D.,P.E. 7
figure 2. length of pipe from each region that responded to the basicsurvey. figure 3. length of pipe from each region that responded to the detailedsurvey. SizE ofSURvEy PARTiCiPAnTS Four categories were established as shown in Table 2 and each survey participant was allocated to one of the categories. Figure 4 shows the distribution of total miles from the basic survey based on these categories. Respondents covered the range from very small to very large with each group from Table 2 wellrepresented. Table 2. grouping of utilitysize. 8 Water Main Break Rates in the USA and Canada: AComprehensive Study April 2012 Utah State University Buried Structures Laboratory | Steven Folkman, Ph.D.,P.E.
Figure 4. Total miles of pipe in each size group defined in Table 2 based on the basic surveyrespondents. MilES ofPiPE vS. PoPUlATion Figure 5 illustrates the relationship between the population served by the utilities participating in the basic survey and the number of miles of water main pipe. The trend line and equation are a best fit to the data. The slope of this line indicates that there are on average 264 people served for each mile of water maininstalled. figure 5. Population served relative to total pipe line miles from the basicsurvey. Water Main Break Rates in the USA and Canada: A ComprehensiveStudy April 2012 Utah State University Buried Structures Laboratory | Steven Folkman, Ph.D.,P.E. 9
SURvEySAMPlESizE:10% ofinSTAllEdWATERMAin PiPE inThEUS Thetotallengthofwatermainpipereportedbythe188basicsurveyparticipantswas117,603miles(thesurveydid notincludesewerorforcemains).Theaverageutilitysurveyedhad626milesofwatermainwiththelargesthaving 4,468milesandthesmallesthaving2miles.BasedonanEPAreport(EPA,2007),thereareapproximately880,000 miles of distribution pipe in the USA. Another EPA report (EPA, 2008) estimates the amount of installed water main pipeintheUSAatover1,000,000miles.ThecurrentpopulationoftheUSAis312million(USCensus,2011).Using the estimate from the previous section of 264 people served per mile of water main, one can estimate the length of water mains as (312 million people)/(264 people/mile) = 1.18 million miles of water main pipe. Using this last estimate, the total length of pipe in the survey would represent approximately 10% of the installed water main pipe in the USA. Thus, the survey sample size is significant in size and therefore provides reliable results. Note that the Canadian provinces provided 8,423 miles of pipe to this survey or 7.4% of thetotal. PiPEMATERiAlS Table 3 lists the pipe materials and their abbreviation used in this report. Many pipe products have evolved over the years of use, and most pipe products could be broken down into subcategories based on pipe manufacturing and surface treatments. These changes along with new installation techniques should affect life expectancy of the pipe. Both the basic and detailed surveys were intended to be relatively simple to complete and, thus, encourage wide scale participation of the water utilities. Most utilities have limited records as to which specific pipe materials were installed decades ago and what corrosion protection measures were used. Therefore, tracking subcategories of material types was not completed as part of this study. The results reported represent generic pipe material behavior but may not represent a specific product material on the markettoday. Table 3. Materialabbreviations. Figure6illustratesthelengthofpipereportedinthebasicsurveybrokendownbypipematerial.The“Other”category in Figure 6 includes materials such as HDPE, galvanized steel, and copper. Figure 7 illustrates the length of pipe reported in the detailed survey broken down by pipe material. Figure 8 illustrates the pipe material distribution as a percentage of the total length from both the basic and detailed surveys. The distribution of miles of pipe is quite similarinFigure8indicatingthatthedetailedsurveywithasmallernumberofrespondentsstillgivessimilarresults. figure 6. length of pipe broken down by material type from the basicsurvey. 10 Water Main Break Rates in the USA and Canada: AComprehensive Study April 2012 Utah State University Buried Structures Laboratory | Steven Folkman, Ph.D.,P.E.
figure 7. length of pipe broken down by material type from the detailedsurvey. figure 8. Percentage of total length of pipe by material type from both the basic and detailedsurveys. Water Main Break Rates in the USA and Canada: A ComprehensiveStudy April 2012 Utah State University Buried Structures Laboratory | Steven Folkman, Ph.D.,P.E. 11
Figure9illustratestheregionaldistributionofpipematerialusageasapercentageofthetotallengthinthatregion. Itisinterestingtonotethesignificantdifferencesinregionalpipematerialutilization.CastandDuctileIronrepresent approximately 90% of the pipe in regions 6 and 8. PVC has a dominant role in region 9 and is well established in regions 2, 3, 4, 5, and7. figure 9. Regional percentage of length of pipe by material type from the basicsurvey. 12 Water Main Break Rates in the USA and Canada: AComprehensive Study April 2012 Utah State University Buried Structures Laboratory | Steven Folkman, Ph.D.,P.E.
PiPE AgE AnddiAMETER The detailed survey asked respondents to provide the distribution of installed pipe by age. Four age groups were provided;zeroto10years,10to20years,20to50years,andover50years.Figure10liststhepercentageofwater mainlengththatfitsineachagecategory.Figure10indicatesthatapproximately43%ofinstalledpipeareinthe20 to 50 year age category and 22% are over 50 years of age. This finding is consistent with other industrysources. figure 10. Percent of length of pipe by age from the detailedsurvey. The respondents were also asked to break down the fraction of total installed pipe length by five pipe diameter categories. Figure 11 illustrates the percentage of water main that fit into each size range. Figure 11 indicates that approximately 66% of the installed pipe is 8 inches or less indiameter. figure 11. Percent of length of pipe by pipe diameter from the detailedsurvey. Water Main Break Rates in the USA and Canada: A ComprehensiveStudy April 2012 Utah State University Buried Structures Laboratory | Steven Folkman, Ph.D.,P.E. 13
dElivERyPRESSURE Based on the detailed survey, the average delivery pressure is 77 psi. The range of values reported for average delivery pressure was 45 to 150 psi. The detailed survey also asked how much does the water pressure fluctuate at any given point in their system during a typical day. The respondents were asked to select one of three ranges. Figure 12 illustrates the percentage of respondents that fit into each pressure range. About 83% are able to limit pressure fluctuations to be less than 20psi. Figure 12. Percentage of respondents with one of three pressure fluctuationranges. MoSTCoMMonfAilUREModE,MATERiAl,AndAgE The detailed survey asked the respondents to identify the most common failure mode by selecting from one of the following; corrosion, circumferential crack, longitudinal crack, leakage at joints, fatigue, or other. Figure 13 identifies a circumferential crack as the most common failure mode followed by corrosion. The detailed survey also asked respondents to identify the pipe material that was failing most often. Figure 14 shows that 55.3% of respondentsidentifiedCastIronasthemostcommonfailingpipematerialfollowedbyAsbestosCementat17.0%. Therespondentsalsoreportedthetypicalageofafailingwatermain.Theaverageresultwas47yearswitharange ofvaluesfrom20to86years.Thesurveyalsoaskedwhattheexpectedlifeshouldbewheninstallingnewpipe.The average expected life of new pipe was 79 years with a range of responses from 30 to 200years. figure 13. Percent of respondents selecting a most commonfailure. 14 Water Main Break Rates in the USA and Canada: AComprehensive Study April 2012 Utah State University Buried Structures Laboratory | Steven Folkman, Ph.D.,P.E.
figure 14. Percent of respondents selecting a most common failurematerial. CoMPUTing WATER MAin fAilURERATES Both the basic and detailed surveys asked respondents to consider a water main failure as one where leakage was detected and repairs were made. However, they were requested to not report failures due to joint leakage, construction damage, or tapping of service lines. The goal was to examine how installed pipeperforms. Utilitiesreportedthenumberoffailuresoverarecent12monthperiodforeachpipematerialandtheinstalledlength of each pipe material. The failure rate was computed by dividing the total number of failures from all utilities for a particular pipe material by the total length of that pipematerial. For example, the survey reported a total of 12,963 failures of water mains during a recent 12 month period for all pipe materials. The total installed water main length from the survey was 117, 603 miles (or 1176.03 hundreds of miles). Thus the overall failure rate is 12,963/1176.03 = 11.0 failures/(100miles)/year. This simple method for computing failure rates was used because it discourages biases toward large or small utilities.Itisnotedthatutilitiesexperiencewidelydifferentfailureratesforthesamepipematerial.Severalsignificant variables affect the results including pipe age, soil types (corrosive or noncorrosive), different corrosion prevention techniques, different installation practices, and climate. fAilURE RATES foREACh PiPE MATERiAl Thesurveymeasuredpipefailuresoverarecent12monthperiod,brokendownbymaterialtype.Table4liststhetotal lengthofpipebymaterialtype,thenumberoffailuresoverarecent12monthperiod,andthefailurerateforeachpipe material.Figure15illustratesthefailureratesasafunctionofmaterialtype.Ifoneassumesautilityhadequallengths of each material installed, then Figure 16 would illustrate the percentage of failures as a function of pipe material. Figure17givesthefailurerates brokendownbymaterialtypeandbyrespondentsfromtheUSAandCanada. Table 4. Summary of failure data from the basic survey over a 12 monthperiod. Water Main Break Rates in the USA and Canada: A ComprehensiveStudy April 2012 Utah State University Buried Structures Laboratory | Steven Folkman, Ph.D.,P.E. 15
figure 15. failure rates of each pipe material from the basicsurvey. figure 16. Percentage of failures attributed to each pipe material assuming equal lengths of material wereinstalled. figure 17. Comparison of failure rates from USA andCanada. 16 Water Main Break Rates in the USA and Canada: AComprehensive Study April 2012 Utah State University Buried Structures Laboratory | Steven Folkman, Ph.D.,P.E.
fAilURE RATES ovER fivEyEARS The detailed survey requested the respondents to list the number of failures per year for five years, broken down by material type. The desired focus was to examine the year to year variations by pipe material. A single utility mighthavelargeyeartoyearvariations,butifthenumberofutilitiessampledissufficient,theyeartoyearvariation should be small. Figure 18 shows the failure rates from the detailed survey from each of the five years covered by the survey. Respondents that did not have five years of data were not included in theseresults. Figure 18. Pipe failure rates over a five year period as a function of pipematerial. Table 5 lists the average of the failure rates over the five year period along with the standard deviation and the coefficients of variation (the standard deviation divided by the average). The coefficients of variations for CI, DI, and PVC are similar indicating they have approximately the same variability. The widest variation in rates was associated with CPP, steel and AC pipe. The length of pipe in the detailed survey for these materials was small and more respondents could likely reduce thevariability. Table 5. Statistical summary of the five year failure rate data. EffECTS ofAgE Clearly, pipe age will affect failure rates. The basic survey asked respondents to break down the failures into five different pipe age categories. It is noted that some of the respondents did not know the age of the failed pipes, and they were not included in the results below. For each material type, the fraction of failures in each age group is examined in Figure 19 based on the basic survey results. For example, 49.8% of the reported cast iron failures occurred with a pipe age between 41 and 60 years. Note that the largest percentage of failures is not in the oldest pipes, which has several possible causes. First, the older pipe is being replaced, and, thus, there is less available tofail. Water Main Break Rates in the USA and Canada: A ComprehensiveStudy April 2012 Utah State University Buried Structures Laboratory | Steven Folkman, Ph.D.,P.E. 17
figure 19. Percent of failures as a function of age and pipematerial. The results in Figure 19 are related to when a pipe material was introduced or removed from the market.Asbestos Cement pipe has not been installed in the USA and Canada in the past 20 years, and, thus, all AC pipe failures exceed 20 years of age. Widespread DI and PVC pipe production in the USA did not start until about 1970, so we shouldexpecttoseeasmallfailurepercentageforbothDIandPVCinthe41to60yearagegroupandnoneforthe 61 to 80 and 80+ age groups. PVC follows that trend in Figure 19. Figure 19 shows the majority of DI pipe failures occur at an age between 21 and 40 years. The DI results in Figure 19 for the 61 to 80 and the 80+ age groups are possibly caused by incorrect records on the age of those failedpipes. It is of interest that Figure 19 shows a greater percentage of PVC pipes fail in the first 20 years of use than in the next20years**.ThiswasinvestigatedinaprevioussurveyfundedbyAWWARF(Moser,1994).Figure20illustrates the percent of failures as a function of time for AWWA rated PVC pipe. As shown below, over 40% of the reported failures occurred in the first year. Often the cause of these failures in PVC pipe is related to improper installation practices and not a defect in the pipe. The city of Calgary has been able to achieve remarkably small PVC failure rates due to enforced construction standards (Brander, 2004). In addition, Calgary requires new subdivision infrastructure to remain the property of the private developer for a period of two years. During this two year period, most construction related problems will occur. An AWWARF study (Burn, 2006) estimates the design life of PVC to be in excess of 110years. 18 Water Main Break Rates in the USA and Canada: AComprehensive Study April 2012 Utah State University Buried Structures Laboratory | Steven Folkman, Ph.D.,P.E.
figure 20. PvC failures as a function of time (adapted from Moser,1994). The expected life in years of an unprotected DI pipe was estimated in a recent Water Research Foundation study (Rajani,2011).Figure21illustratesthepublishedresultsasafunctionofarelativescaleofsoilcorrosivity.Figure19 indicatesthatthemajorityofDIpipefailuresoccuratanagebetween21and40years.A21to40yearlifeinFigure 21wouldcorrespondtoalowtomoderatesoilcorrosivityforanunprotectedpipe.Thiswouldindicatethatcorrosion isasignificantprobleminallregionsofthisstudy.WhenacomparisonismadebetweenCastIronandDuctileIron, thinner-walledDuctileIronisexperiencingfailuresmorerapidly(21-40yearperiod)thanthethicker-walledcastiron (41-60 year period). Concrete Pressure Pipe also shows failures rates that are impacted by corrosion in the 21-40 year period. The study also notes that “aging or deterioration of ductile iron pipes can vary significantly from one geographical region to another within a city, let alone from city to city.” figure 21. Predicted life of unprotected class 350 di pipe (from Rajani,2011). Water Main Break Rates in the USA and Canada: A ComprehensiveStudy April 2012 Utah State University Buried Structures Laboratory | Steven Folkman, Ph.D.,P.E. 19
dESCRiPTion offAilURES • Respondentstothebasicsurveywereaskedtodescribethetypeoffailuresobservedbypickingfromthefollowinglist: • Circumferential crack orfracture • Longitudinal crack orsplit • Pits or holes(corrosion) • Other orUnknown • Figure22summarizesthepercentageoffailuresthatwerereportedtofitineachdescription.Acircumferentialcrack is the primary failure mode for Cast Iron, Concrete and Asbestos Cement pipe. Corrosion is the primary failure mode of Ductile Iron and Steel pipe. A longitudinal crack is the primary failure mode ofPVC. • figure 22. description of failure for each pipematerial. 20 Water Main Break Rates in the USA and Canada: AComprehensive Study April 2012 Utah State University Buried Structures Laboratory | Steven Folkman, Ph.D.,P.E.
PlAnS foRREPlACing WATER MAinS The detailed survey asked if the respondents had a plan for regular replacement of water mains that are nearing theirendofusefullife.Over77%reportedtheydohaveareplacementplan.Thesurveyalsoaskedwhatpercentage of water mains are beyond their useful life but have yet to be repaired/replaced due to a lack of funds. The survey results showed a range of answers from zero to 75% of their pipe was beyond its useful life and the average of all respondents was that 8.4% of the pipe is beyond its usefullife. ItisofinteresttocomparetheseresultswithastudydonebytheEPA(EPA,2002).Thisstudyclassifiedwatermain pipe condition into six categories; Excellent, Good, Fair, Poor, Very Poor, and Life Elapsed. The study examined data for years 1980 and 2000 and forecasted data for 2020. Figure 23 below is reproduced from their report and shows that the above mentioned survey average response of 8.4% of pipe are beyond their useful life would correspond well with the “Life Elapsed” category in Figure 23. It is very important to note the projected growth in the “Very Poor” condition category in Figure 23. The rate of growth in that category will make it much more difficult for utilities to get that pipe replaced before it reaches the “Life Elapsed” category. An AWWA study (AWWA, 2012) echoes this trend as illustrated in Table 6. Table 6 shows aggregate costs to cover both replacement and growth in water mains in the USA. figure 23. Assessment of pipe condition with time (from EPA,2002). Percentage of Pipe by Classification Table 6. Aggregate needs for investment in water mains through 2035 and 2050 by region of the United States (from AWWA,2012). Water Main Break Rates in the USA and Canada: A ComprehensiveStudy April 2012 Utah State University Buried Structures Laboratory | Steven Folkman, Ph.D.,P.E. 21
ConTRACToRExPERiEnCE Proper installation is very important to getting the maximum life out of a water main. The detailed survey asked if their utility utilized contractor experience used as a weighting factor when selecting a contractor. There are 66% of the respondents that do consider contractor experience. Many of those who do not consider contractor experience reported that state or local laws prevented them from doingso. AlloWEd PiPEMATERiAlS The detailed survey also asked what water main pipe materials are currently excluded from being installed at their utility. Figure 24 illustrates the percentage of respondents that allow a particular pipe material to be installed. The reasons used for excluding a pipe material were also requested in the survey. Table 7 summarizes the most common comments made for exclusion of a pipematerial. figure 24. Percent of respondents that will allow installation of these water main pipematerials. Table 7. Typical comments forexclusion. lEAK dETECTionMEThodS Thedetailedsurveyaskedifregularleakdetectionmethodswereutilizedattheirutilityand57%oftherespondents indicated that they did. The methods of leak detection that were used included acoustic leak detectors, visual inspection of lines, digital correlation sensors, and eddy currentdetectors. 22 Water Main Break Rates in the USA and Canada: AComprehensive Study April 2012 Utah State University Buried Structures Laboratory | Steven Folkman, Ph.D.,P.E.
CoRRoSivESoilSAndCoRRoSionPREvEnTion TREATMEnTS The detailed survey asked respondents if they have one or more regions in their service area with soils that tend tobe corrosive.Atotal of75%oftherespondentsreportedthattheydo haveatleastone area withcorrosivesoils. ThesurveyalsoaskedwhatkindofcorrosiontreatmentstheyareutilizingforDI, CPP,andSteelpipes.Thetypical results are summarized in Table8. Table 8. Typical corrosion preventiontreatments. EffECTofAMBiEnTTEMPERATUREonfAilURES The detailed survey asked if the utility observed an increase in water main failures with extreme ambient temperatures, either warm or cold. The results of the survey indicated that 72% of the respondents did note an increase in pipe failures with extreme cold ambient temperatures and only 13% reported a correlation with warm temperatures.Clearlythisresultwouldbedependentontheclimateateachutility.Theaveragedepthofburialwas alsoreported.Aneffortwasmadetoseeifthereisacorrelationbetweentemperaturesextremesandburialdepths. For each utility the temperature extremes were derived from average monthly temperatures. The highest average monthly temperature in the summer and the lowest average monthly temperature during the winter were recorded for each utilitylocation. Figure25plotsthelowestaverageminimummonthlytemperatureduringtheyearforeachrespondentversustheir reported average burial depth. The utilities with the blue symbols indicated they are not sensitive to cold ambient temperatures and the red colored symbols are sensitive. It was thought that with sufficient burial depth, the low temperature sensitivity might be reduced, but the data in Figure 25 does not support thatconjecture. figure 25. Correlation of the lowest average minimum monthly temperature during the year and burial depth. Red symbols note locations where failures increase with low ambienttemperatures. Water Main Break Rates in the USA and Canada: A ComprehensiveStudy April 2012 Utah State University Buried Structures Laboratory | Steven Folkman, Ph.D.,P.E. 23
Figure 26 plots the highest average maximum monthly temperature during the year for each respondent versus their reported average burial depth. Again, the color of the symbol indicates whether that utility reported to be sensitive to high ambient temperatures. Again, no correlation wasobserved. It is noted that one respondent reported that failures increase when large and rapid ambient temperature changes occurred, but not necessarily reaching extremetemperatures. figure 26. Correlation of the highest average maximum monthly temperature during the year and burial depth. Red symbols note locations where failures increase with high ambienttemperatures. 24 Water Main Break Rates in the USA and Canada: AComprehensive Study April 2012 Utah State University Buried Structures Laboratory | Steven Folkman, Ph.D.,P.E.
TREnChlESS TEChnologyUSE The detailed survey asked respondents about experiences with three techniques of repairing, replacing, and installing water main pipes. They were relining deteriorated pipes, replacing pipes with a pipe bursting technique, andinstallationofnewpipesusingdirectionaldrilling.Table9summarizestheirresponses.TheratingscaleinTable 9 is from 1 to 5 with 1 being “Not Satisfied” to 5 being “Very Satisfied”. Not many respondents have utilized pipe bursting, but an increasing number are looking at using both pipe relining and pipe bursting techniques. A majority of respondents have utilized directional drilling and are very happy with theresults. Table 9. Summary of responses for relining, bursting, and directionaldrilling. • concluSion • This Comprehensive Water Main Break Study surveyed a statistically significant amount of utilities that have collected data on their underground infrastructure. This survey was focused on material usage in water mains acrosstheUSAandCanada.Thiseffortwassuccessfulingetting188participantstorespondtoabasicsurveyand 47 of those to respond to a more detailed survey. Significant results from this studyinclude: • A correlation of people served permile • Current pipe material usage with a regionalbreakdown • Pipe age and size distribution • Average operation and fluctuation pressures • Most common pipe failure mode andmaterials • Pipe failure rates for six mostly commonly used pipematerials • The distribution of pipe failures with pipe age for eachmaterial • The distribution of pipe failure modes for eachmaterial • Percentage of utilities that allow installation of certain pipematerials • Percentage of utilities with corrosive soils and preventiontechniques • Effects of ambient temperature swings on failures • Attitudes about use of pipe relining, pipe bursting, and directionaldrilling. • It is hoped that these results would be helpful to utility managers in comparing their experiences with these survey results and thereby make better decisions regarding possible changes in their management practices. Through understandingmoreabouttheissuessurroundingtheperformanceofourundergroundwaterinfrastructure,utilities will be able to successfully make cost-effective pipe replacement decisions. Water Main Break Rates in the USA and Canada: A ComprehensiveStudy April 2012 Utah State University Buried Structures Laboratory | Steven Folkman, Ph.D.,P.E. 25
ACKnoWlEdgEMEnTS This work was completed with support from Uni-Bell PVC Pipe Association and the Water Finance Research Foundation. REfEREnCES ASCE, “2009 Report Card for America’s Infrastructure,” http://www.asce.org/reportcard/, last accessed,3/24/2012. AWWA, “Dawn of the Replacement Era: Reinvesting in Drinking Water Infrastructure,” AWWA, Denver, CO, 2001. AWWA, “Buried No Longer: Confronting America’s Water Infrastructure Challenge,” Denver CO,2012. Brander, R., “Minimizing Failures to PVC Water Mains,” Proceedings of Plastic Pipe XII Conference, Milan, Italy, April 19 - 22,2004. Burn, S. et. al., “Long-term Performance Prediction for PVC Pipes,” AWWARF Report 91092F, May2006. EPA, “The Clean Water and Drinking Water Infrastructure Gap Analysis,” United States Environmental Protection Agency, Office of Water, EPA-816-R-02-020, September,2002. EPA, “Distribution System Inventory, Integrity and Water Quality”, January 2007, available at http://www.epa.gov/ ogwdw/disinfection/tcr/pdfs, last accessed,10/5/2011. Moser,A.P.&Kellogg,K.,“EvaluationofPolyvinylChloride(PVC)PipePerformance,”AWWAResearchFoundation, Project #708, Order #90644, February, 1994. Rajani, B., McDonald, S., and Felio, G., “Water Mains Break Data on Different Pipe Materials for 1992 and 1992,” National ResearchCouncilCanada, Institute for Research in Construction (Canada), A-7019.1,1995. Rajani, B., Kleiner, Y. and Krys, D. “Long Term Performance of Ductile Iron Pipe,” Research report #3036, Water Research Foundation, Denver, CO.,2011. Royer,M.D.,“ConditionAssessmentofDrinkingWaterTransmissionandDistributionSystems,”presentedat U.S. EPA Science Forum 2008, Washington, DC, May 20-22, 2008. Available from: http://www.epa.gov/nrmrl/ pubs/600f11010/600f11010.pdf, last accessed, 10/5/2011. US Census, from: http://www.census.gov/, last accessed, 10/5/2011. WaterInfrastructureNetwork(WIN),2002,“WaterInfrastructureNow;RecommendationsforCleanandSafeWater in the 21st Century,” http://www.win-water.org/reports/winow.pdf, last accessed3/24/2012. 26 Water Main Break Rates in the USA and Canada: AComprehensive Study April 2012 Utah State University Buried Structures Laboratory | Steven Folkman, Ph.D.,P.E.