Download
1 / 21
230 likes | 394 Vues
ISOTOPE FRACTIONATION FACTORS ASSOCIATED WITH SOIL DENITRIFICATION. Dominika Lewicka-Szczebak 1 ,2 , Reinhard Well 2 , Laura Cardenas 3 , Peter Matthews 4 , Roland Bol 3 , Lena Rohe 1 1 Thünen-Institut, Germany, 2 Uni versity of Wroclaw, Poland

E N D
ISOTOPE FRACTIONATION FACTORS ASSOCIATED WITH SOIL DENITRIFICATION • Dominika Lewicka-Szczebak1,2 , Reinhard Well2, • Laura Cardenas3, Peter Matthews4, Roland Bol3, • Lena Rohe1 • 1 Thünen-Institut, Germany, 2University of Wroclaw, Poland • 3 Rothamsted Research,UK, 4University of Plymouth, UK, • 5 Agrosphere Institute, Germany
Introduction ISOTOPE FRACTIONATION FACTORS DENITRIFICATION PROCESSES N2O production N2O reduction β α- position N2O reduction SP= α-β N N O N N N2 preferredconsumption of bondswith 14Nand16O ε N2O N O N2O production N N O ε NO ε differentiationwithinthemolecule O O N O ε H H NO2- exchange of O-isotopes withsoilwater ε changeinSP (SitePreference) NO3- N N O β α- position O ε O H H N O O sum of ε → NIE – Net IsotopeEffects → ƞ of 3 independent factors: δ15N, δ18O, SP N N N N N enrichment in 15N e.g. ƞ 15N: -45 - -13‰ O O O enrichment in 18O
Introduction OBJECTIVES OF MODELING APROACH Determination of Net IsotopeEffects of productionand reduction Comparison of NIEs for differentreaction dynamics and different experimental conditions Development of a method to calculate reduction contribution based on isotopomers data
Introduction RAYLEIGH EQUATIONS δS- isotopicsignature of substrateinparticular point of thereaction δ S0 - isotopicsignature of substrateprior to initiation of thereaction f - remainingunreactedfraction ƞP-S- Net IsotopeEffect (NIE) betweenproduct and substrate (Mariotti et al., 1981) δ15N N2O production δS NO32- δP η N2O δS0=0‰ η remaining nitrate
Introduction RAYLEIGH EQUATIONS δS- isotopicsignature of substrateinparticular point of thereaction δ S0 - isotopicsignature of substrateprior to initiation of thereaction f - remainingunreactedfraction ƞP-S- Net IsotopeEffect (NIE) betweenproduct and substrate (Mariotti et al., 1981) δ15N N2O production + reduction δS NO32- δP η N2O δS0=0‰ η fred=0.8 fred=0.5 δS0 fred=0.2 remaining nitrate
Methods EXPERIMENTS DESIGN 1 known reduction only N2O production 8 variants, 1 water saturation:75 WFPS C2H2 addition reduction inhibition no C2H2 reduction occurs gas samples each 2/4/12h • GC-analyses N2O • isotopomers analysis (15N, 18O, SP in N2O) • 15N (N2), 15N (N2O) analysis soil samples beginning / end • NO3- content • δ15N, δ18O of NO3-
Methods / Results MODELING STRATEGY 1 only N2O production + known N2O reduction INPUTS INPUTS N2O emission NO3- consumption δ15N, δ18O of NO3- δ15N, δ18O, SP of N2O f unconsumed NO3- N2O emission NO3- consumption δ15N, δ18O of NO3- ƞP-S of N2O production δ15N, δ18O, SP of N2O 15N (N2), 15N (N2O) δS0 N2O before reduction δS, δS0 δS f unreduced fraction OUTPUTS ƞP-Sof N2Oproduction OUTPUTS ƞP-Sof N2Oreduction fast rate reaction
Methods EXPERIMENTS DESIGN 2 on-line GC-analyses 1.5h time step known reduction amendment addition samples for isotopomers analysis once a day ‘DENIS’ incubation system 3 water saturations: 100 WFPS, 94 WFPS, 85 WFPS
Methods / Results MODELING STRATEGY 2 known N2O reduction INPUTS found by itinerations to reachthebest fit betweenmodeled and measuredvalues (Rock et al., 2011) OUTPUTS (Well & Flessa, 2009) pool2 – high reductionratio produced SP range: from -10‰ (bacteria) to 36‰ (fungi) minimalvalue of δ18O ca. 10 ‰ (Ostrom & Ostrom, 2011) (Snider et al., 2011)
Methods / Results IMPROVED MODELING STRATEGY 2 INPUTS OUTPUTS OUTPUTS INPUTS pool2 – high reductionratio I wyniki – że zależy od tempa procesu, mniejsze/większe – różne poole
ResultsFIT OF MEASURED AND MODELED DATA SAT/sat δ15N UNSAT/sat HALFSAT/sat
DiscussionCONTROLLING FACTORS 15N NIE of production increasing reactions rates – – smaller fractionation factors increasing production rate smaller difference between product and substrate increasing soil moisture– – smaller fractionation factors ε - FRACTIONATION FACTORS K - PROCESS RATES increasing water content enzymatic reaction diffusion into cell enzyme activity diffusion diffusion out of cell 100% WFPS 94% WFPS 85% WFPS 75% WFPS (Farquar et al., 1982; Ostrom & Ostrom, 2011; Well et al., acc.)
DiscussionCONTROLLING FACTORS 15N NIE of reduction increasing substrate availability – – higher fractionation factors increasing reduction ratio higher difference between product and substrate decreasing soil moisture– – higher fractionation factors ε - FRACTIONATION FACTORS K - PROCESS RATES enzymatic reaction diffusion into cell enzyme activity diffusion diffusion out of cell unreduced fraction increasing substrate availability (Jinuntuya-Nortman et al., 2008, Ostrom & Ostrom, 2011)
DiscussionCONTROLLING FACTORS produced 18O increasingreactionsrates– –higherδvalues – lowerequilibriumwithsoilwater ? 100% WFPS 94% WFPS 85% WFPS 75% WFPS
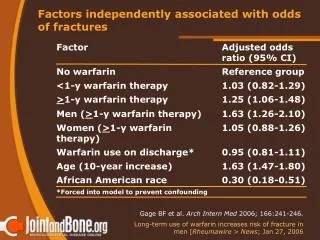
Conclusions • Wide range of Net Isotope Effects associated with denitrification N2O production and reductionƞ15N: -43 - -18‰ ƞ15N: -9 - -1‰δ18O: 10 - 40‰ ƞ18O: -20 - -4‰ ƞSP: -10 - 1‰ ƞSP: -12 - -2‰ • The magnitude of isotope effects is controlled by several factorshigher NIEs when lower reactions rates, higher substrate availability, more efficient substrate transportation (e.g. lower soil moisture) • Modelling aproach provides promising results for future development of a method to calculate reduction contribution based on isotopomers data -45 - -13‰ -9 - -5‰ 11 - 24‰ -20 - -13‰ -10 - 10‰ -8 - -3‰ * * *previous literature data (Well & Flessa, 2009; Ostrom & Ostrom, 2011)
N N N N O N N N N O N N N N O N N N N O N N N N O N N N N O N N N N O N N N N O N N N N O N N N N O N N N N O N N N N O THANK YOU FOR YOUR ATTENTION • This research was funded by the UK Biotechnology and Biological Sciences Research Council (BBSRC) with competitive grants BB/E001580/1 and BB/E001793/1 and by Deutsche Forschungsgemeinschaft (DFG) WE-1904-4. • The first authoris suppored by the Foundation for Polish Science. • DominikaLewicka-Szczebak
MethodsMODEL CONSTRUCTION amendment pool1 emission terminated POOL1 – fast production, low reduction POOL2 – slow production, high reduction (Bergstermann et al., 2011)
ResultsFIT OF MEASURED AND MODELED DATA SAT/sat SP UNSAT/sat HALFSAT/sat
ResultsFIT OF MEASURED AND MODELED DATA SAT/sat δ18O HALFSAT/sat UNSAT/sat
N2-free atmosphere N N N N O O H H O NO3- N O O
N N N N O N N O C glucose 15NO3- O N O O O N C glucose O O NO3- O 15NO3- N O O O N O O NO3-