Download
1 / 15
150 likes | 235 Vues
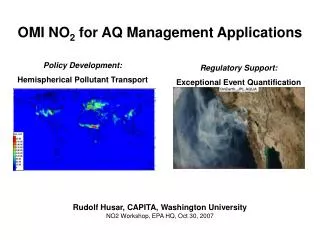
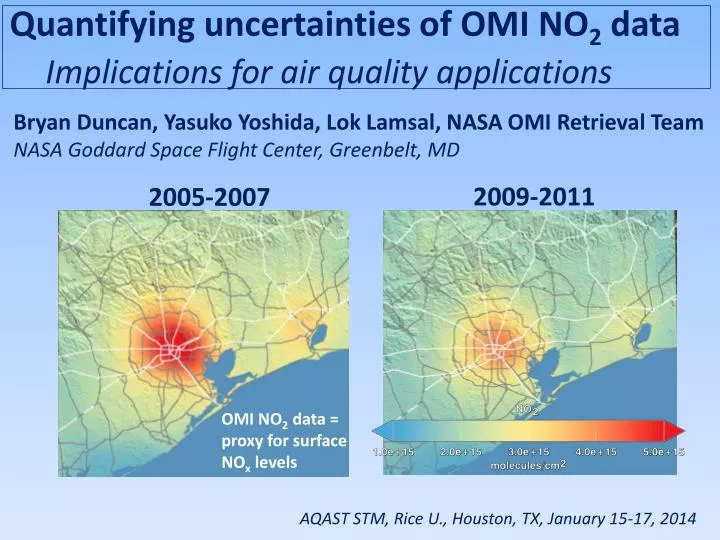
Quantifying uncertainties of OMI NO 2 data Implications for air quality applications. Bryan Duncan, Yasuko Yoshida, Lok Lamsal, NASA OMI Retrieval Team NASA Goddard Space Flight Center, Greenbelt, MD. 2009-2011. 2005-2007. OMI NO 2 data = proxy for surface NO x levels.

E N D
Quantifying uncertainties of OMI NO2 data Implications for air quality applications Bryan Duncan,Yasuko Yoshida, Lok Lamsal, NASA OMI Retrieval Team NASA Goddard Space Flight Center, Greenbelt, MD 2009-2011 2005-2007 OMI NO2 data = proxy for surface NOx levels AQAST STM, Rice U., Houston, TX, January 15-17, 2014
Policy-Relevance Goal:Use OMI NO2 satellite data to monitor changes & trends in NOx & NOx emissions, particularly where AQS monitors are sparse or absent. Problem: Data uncertainties are not well quantified for AQ applications. ∆OMI NO2 OMI NO2 2005-2012 2012 2005 Ozone Season → as NOx emissions decrease, the signal-to-noise also decreases so that quantification of the uncertainties becomes even more important.
∆OMI NO2 (%) NO2 columns (molecules/cm2) > 0.5x10¹⁵ (probably too low) > 1.0x10¹⁵ > 1.5x10¹⁵ (probably too high) Just how large do you think the uncertainties are – ballpark estimate? 2005-2012 OMI NO2 2012 2005 (x1015 molecules/cm2)
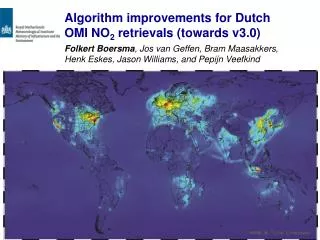
Effort to Better Quantify Uncertainties for AQ Applications While the versions of the OMI NO2 data have improved substantially over the years, there is still room for improvement. NASA OMI Team’s plans for algorithm development: (1) Improved spectral fitting for NO2 - is being developed by our group (KNMI's spectral fitting has problem). (2) High resolution surface reflectivity data base (MODIS) (3) High resolution year-specific a-priori NO2profile shape (4) Inclusion of aerosols in the retrieval of NO2 (5) Development of independent cloud product for use in NO2retrievals. → I’ll continue to work with the OMI Team to improve the NO2 data product for AQ applications.
Aura Ozone Monitoring Instrument (OMI) How does OMI NO2 data compare to surface observations? OMI detects pollution in the free troposphere and boundary layer. The AQS surface sites only detect “nose-level” concentrations.
How do variations in OMI NO2 data compare to CEMS data for power plants? The observed response of Ozone Monitoring Instrument (OMI) NO2 columns to NOx emission controls on power plants in the United States: 2005-2011 Bryan N. Duncan, Yasuko Yoshida, Benjamin de Foy, Lok N. Lamsal, David G. Streets, Zifeng Lu, Kenneth E. Pickering, and Nickolay A. Krotkov Main Conclusions Aura OMI NO2data can be used to a) monitor emissions from power plants and b) demonstrate compliance with environmental regulations. BUT, careful interpretation of the data is necessary.
How do OMI NO2 data compare to AQS data? North East 2 North East 1 Chicago N=23 N=20 N=6 Houston Southern California Central Valley N=32 N=13 N=51 • AQS data: hourly, use 13-14 PM data (corresponding to OMI overpass time) • OMI NO2 data: daily, gridded at 0.1° latitude x 0.1° longitude • Use data if both AQS and OMI are available to compute monthly/annual means
Time series of AQS and OMI NO2 AQS OMI Houston Data are deseasonalized. Normalized Anomaly Change Relative to 2005 (%)
Correlation of monthly mean AQS & OMI NO2 Anomalies Correlation worsens with increasing latitude. North East 2 North East 1 Chicago Houston Southern California Central Valley ** Because the data are normalized, there is no bias.
Time series of AQS and OMI NO2 North East 1 AQS OMI Normalized Anomaly Change Relative to 2005 (%) N North East 2 Normalized Anomaly Change Relative to 2005 (%) N Chicago Likely issue: Improper filtering of OMI data for snow & ice or lack of statistical significance. Normalized Anomaly Change Relative to 2005 (%) N
Time series of AQS and OMI NO2 AQS OMI Houston Normalized Anomaly Change Relative to 2005 (%) S. California Normalized Anomaly Change Relative to 2005 (%) Central Valley Normalized Anomaly Change Relative to 2005 (%)
∆NO2 (%) from 2005 to 2012 Largest decreases in areas with large regional backgrounds. AQS OMI * Used data from April to October only.
Effort to Better Quantify Uncertainties for AQ Applications Some issues to investigate: I) Sensitivity tests to understand the impact of assumptions made in the creation of the OMI data product. For instance, the influence of trends in: a) Aerosols, surface reflectivities, and clouds. b) Vertical profile shape as NO2 continues to decrease. c) Stratospheric and free tropospheric NO2. d) Etc. II)Coastal cities (e.g., Seattle, San Francisco) “Interpretation of data in coastal locations is difficult due to (1) complex natural variability by stronger wind and (2) errors in retrievals. Auxiliary information on reflectivity and profile shape, both of which affect the retrievals, could be far from the reality.”
Power Plants(~68% decrease since late 1990s) → 1998 NOx State Implementation Plan (SIP) Call 22 eastern states during summer → 2005 Clean Air Interstate Rule (CAIR) 27 eastern states → 2011 Cross-State Air Pollution Rule (CSAPR) 28 eastern states Regulations of NOx Emissions → Emission controls devices (ECDs) were installed on power plants, reducing emissions (e.g., 90%). 2) Mobile Source(~43% decrease since late 1990s) → Clean Air Act Amendments (CAAA) of 1990 Tier 1 (phased-in between 1994 and 1997) standards Tier 2 (phased-in between 2004 and 2009) standards