Download
1 / 15
150 likes | 221 Vues
Using State Data to Make A Case. 25 th Annual COE Conference New York City, NY. What’s the importance of impact data?. Program improvement Accountability to funders Demonstrate value to potential participants, funders, partners, and others . What is impact data?.

E N D
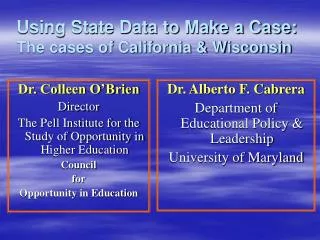
Using State Data to Make A Case 25th Annual COE Conference New York City, NY COE 25th Annual Conference 9.07.06
What’s the importance of impact data? • Program improvement • Accountability to funders • Demonstrate value to potential participants, funders, partners, and others COE 25th Annual Conference 9.07.06
What is impact data? • Program outcomes including: • Promotion, academic achievement, and high school graduation • Participation in the admissions process, including enrollment in a postsecondary institution • Receipt of financial aid, including prestigious scholarships • Academic achievement in college, including GPA, and field of study COE 25th Annual Conference 9.07.06
What is impact data? (cont.) • Transfer from two-year to four-year • Persistence, retention and degree completion • Engagement / Participation in academic and other campus activities, particularly leadership roles • Civic and community engagement • Beyond college: Graduate school, employment, and contributions to the community COE 25th Annual Conference 9.07.06
Sources of Impact Data • APR reports • Information from high schools, districts, state databases • Federal sources, such as the National Student Clearinghouse • Alumni surveys • Impact / Satisfaction surveys: colleges, employers, community COE 25th Annual Conference 9.07.06
Defining your universe • Your own program • Programs in a congressional/legislative district • Programs throughout the state and/or region • Across a specific program type (all UBs or all McNair) COE 25th Annual Conference 9.07.06
Examples in the TRIO Community Veterans’ Upward Bound • Since the program started, the group has made central data collection a priority • Process: send a spreadsheet to all programs asking for key information from the APR • Most recent collection, 30 of 39 programs submit. • Being used to seek additional funding for the programs from corporate and other sources COE 25th Annual Conference 9.07.06
TRIO Examples (cont.) The State of Montana • All programs throughout the state are asked to submit data from their APR • State association collects the data and publishes the information in a report • Demonstrates individual program info, but also statewide numbers • Used with congressional and other policymakers COE 25th Annual Conference 9.07.06
Other statewide efforts • Ohio – OCAN • Working to create a standard data collection tool, and connecting to the statewide database from the Ohio Board of Regents—this will potentially include employment data • Texas State association – collecting data by program across the state. • At least a dozen other states collect and publish data about programs in their states – content varies. Growing potential w/state databases COE 25th Annual Conference 9.07.06
Think about what matters to your audience and then give it to them! • High school dropout • Preparation for high school exit exams and college entrance exams • Program participation in local and state reform efforts • Economic development • Student participation in STEM and other fields • Achievement of special populations COE 25th Annual Conference 9.07.06
COE / Pell Data Collection Efforts • National surveys • Program specific data collection • 2005 – TS/UB outcomes in specific states • 2006 – national survey of TS/UB outcomes • Ongoing – congressional and state • Surveys on specific issues – example $5,000 UB limit COE 25th Annual Conference 9.07.06
Results of Spring 2006 Survey • Nationally, 753 of 1,393 TS & UB programs responded, 54% response rate • 2004-2005 program data • TS – 276 of 466, 59% • Promotion to next grade – 95% • Individual state % range from 31% to 100% (9) • Enrollment of seniors in PSE – 81% • Individual state % range from 47% to 100% (1) COE 25th Annual Conference 9.07.06
Results (cont.) • UB – 451 of 882 – 51% • Promotion to next grade – 97% • Individual state % range from 74% to 100% (23) • Enrollment of seniors in PSE – 84% • Individual state % range from 57% to 100% (1) COE 25th Annual Conference 9.07.06
In the works……. • National collection of program information data – starting with UBMS • Continuation of key congressional focus • Developing new rapid response cohort, (representative of programs, regions, diversity, etc) to answer specific program practice or public policy questions – for example, how many of your UB students would be eligible for the new AC Pell Grants? COE 25th Annual Conference 9.07.06
Contact Information Colleen T. O’Brien, Director The Pell Institute for the Study of Opportunity in Higher Education 1025 Vermont Ave., NW Suite 1020 Washington, DC 20005 www.pellinstitute.org Colleen.obrien@pellinstitute.org Sponsored by the Council for Opportunity in Education COE 25th Annual Conference 9.07.06