Download
1 / 1
10 likes | 109 Vues
B21A-0344. Microbial Growth Inferred from Nutrient Depletion in Deepwater Horizon Submerged Oil/Gas Plumes Alan M. Shiller and DongJoo Joung ; University of Southern Mississippi (alan.shiller@usm.edu). III. Results and calculations

E N D
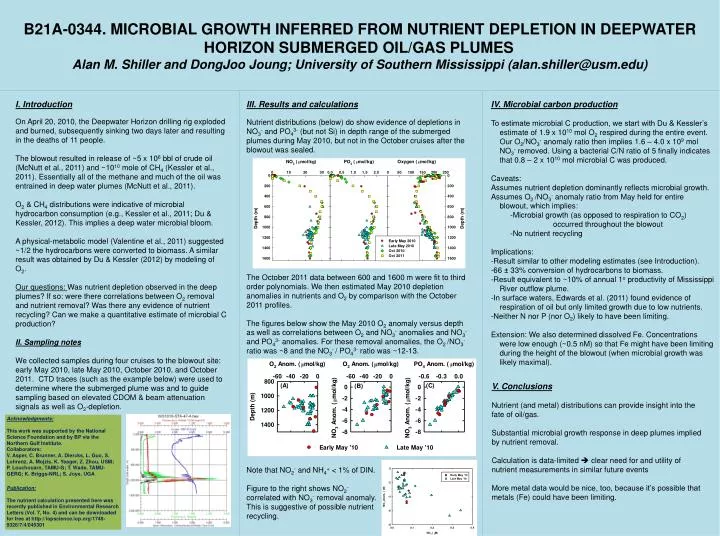
B21A-0344. Microbial Growth Inferred from Nutrient Depletion in Deepwater Horizon Submerged Oil/Gas Plumes Alan M. Shiller and DongJooJoung; University of Southern Mississippi (alan.shiller@usm.edu) III. Results and calculations Nutrient distributions (below) do show evidence of depletions in NO3- and PO43- (but not Si) in depth range of the submerged plumes during May 2010, but not in the October cruises after the blowout was sealed. IV. Microbial carbon production To estimate microbial C production, we start with Du & Kessler’s estimate of 1.9 x 10¹⁰ mol O2 respired during the entire event. Our O2/NO3- anomaly ratio then implies 1.6 – 4.0 x 10⁹ mol NO3- removed. Using a bacterial C/N ratio of 5 finally indicates that 0.8 – 2 x 10¹⁰ mol microbial C was produced. Caveats: Assumes nutrient depletion dominantly reflects microbial growth. Assumes O2 /NO3- anomaly ratio from May held for entire blowout, which implies: -Microbial growth (as opposed to respiration to CO2) occurred throughout the blowout -No nutrient recycling Implications: -Result similar to other modeling estimates (see Introduction). -66 ± 33% conversion of hydrocarbons to biomass. -Result equivalent to ~10% of annual 1o productivity of Mississippi River outflow plume. -In surface waters, Edwards et al. (2011) found evidence of respiration of oil but only limited growth due to low nutrients. -Neither N nor P (nor O2) likely to have been limiting. Extension: We also determined dissolved Fe. Concentrations were low enough (~0.5 nM) so that Fe might have been limiting during the height of the blowout (when microbial growth was likely maximal). I. Introduction On April 20, 2010, the Deepwater Horizon drilling rig exploded and burned, subsequently sinking two days later and resulting in the deaths of 11 people. The blowout resulted in release of ~5 x 10⁶ bbl of crude oil (McNutt et al., 2011) and ~1010 mole of CH4 (Kessler et al., 2011). Essentially all of the methane and much of the oil was entrained in deep water plumes (McNutt et al., 2011). O2 & CH4 distributions were indicative of microbial hydrocarbon consumption (e.g., Kessler et al., 2011; Du & Kessler, 2012). This implies a deep water microbial bloom. A physical-metabolic model (Valentine et al., 2011) suggested ~1/2 the hydrocarbons were converted to biomass. A similar result was obtained by Du & Kessler (2012) by modeling of O2. Our questions: Was nutrient depletion observed in the deep plumes? If so: were there correlations between O2 removal and nutrient removal? Was there any evidence of nutrient recycling? Can we make a quantitative estimate of microbial C production? II. Sampling notes We collected samples during four cruises to the blowout site: early May 2010, late May 2010, October 2010, and October 2011. CTD traces (such as the example below) were used to determine where the submerged plume was and to guide sampling based on elevated CDOM & beam attenuation signals as well as O2-depletion. The October 2011 data between 600 and 1600 m were fit to third order polynomials. We then estimated May 2010 depletion anomalies in nutrients and O2 by comparison with the October 2011 profiles. The figures below show the May 2010 O2 anomaly versus depth as well as correlations between O2 and NO3- anomalies and NO3- and PO43- anomalies. For these removal anomalies, the O2 /NO3- ratio was ~8 and the NO3- / PO43- ratio was ~12-13. V. Conclusions Nutrient (and metal) distributions can provide insight into the fate of oil/gas. Substantial microbial growth response in deep plumes implied by nutrient removal. Calculation is data-limited clear need for and utility of nutrient measurements in similar future events More metal data would be nice, too, because it’s possible that metals (Fe) could have been limiting. Acknowledgments: This work was supported by the National Science Foundation and by BP via the Northern Gulf Institute. Collaborators: V. Asper, C. Brunner, A. Diercks, L. Guo, S. Lohrenz, A. Mojzis, K. Yeager, Z. Zhou, USM; P. Louchouarn, TAMU-G; T. Wade, TAMU-GERG; K. Briggs-NRL; S. Joye, UGA Publication: The nutrient calculation presented here was recently published in Environmental Research Letters (Vol. 7, No. 4) and can be downloaded for free at http://iopscience.iop.org/1748-9326/7/4/045301 Note that NO2- and NH4+ < 1% of DIN. Figure to the right shows NO2- correlated with NO3- removal anomaly. This is suggestive of possible nutrient recycling.