Download
1 / 20

E N D
Electromagnetic Spectrum Information gleaned about the planets in our Solar System can only be accrued through the method of Remote Sensing. This involves understanding the chemical and physical properties of materials and how these characteristics are expressed in the ElectroMagnetic Spectrum (EMS). The EMS is the distribution of EM radiation according to energy level or wavelength and includes such things as visible light, heat, radio waves, x-rays and gamma-rays emitted by radioactive elements.
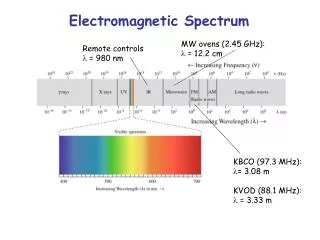
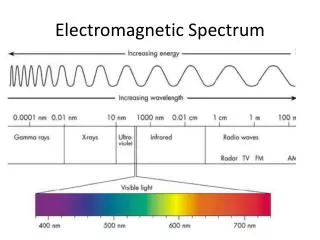
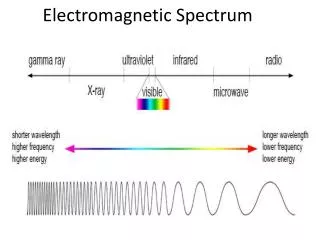
Electromagnetic Spectrum • All matter, natural and man-made, absorbs, reflects, and/or generates radiation • Radiation is energy propagated through both space and matter • EM energy travels at the speed of light (186,000mi/sec)…it’s the LAW • V = f * l • Radiation can be measured according to wavelength, frequency, or electron Volts (eV, i.e. energy level) • Longer l > lower frequency and lower eV • Radio waves • Shorter l > higher frequency and higher eV • Gamma waves
Radiation • Wave vs particle theory – EM energy exhibits characteristics inherent to both particles and waves • Travels at the speed of light • Moves in spherical directions propagating outward in waves • Measurable wavelength (l ) and frequency (f) • Quantifiable strength (charged particles) • Photons – charged particles of radiation w/out mass • Quantum mechanics • More elegant explanation for electron energy levels and energy states (i.e. probability of location of electron in a cloud surrounding the nucleus of an atom • Not so good at scales involved w/astrophysics
Visible light spectrum • Visible light is the only part of the EMS that we can sense with our eyes, but not the only part of the spectrum we can sense • White light (e.g. sunlight) spans all of the primary color wavelengths (red-violet i.e. ROY G BIV) • Visible light spans the small segment of the EM between ~ .4 and .75micrometers • Red light has a wavelength of ~700 nanometers or 7/1,000,000 meter (often given as .7microns) • Red light has a frequency of 428,570 GHz (428,570 billion cycles per second) • When we see red leaves during the fall, the white sunlight incident on the leaf is absorbed at all wavelengths EXCEPT red, so we see the reflected red wavelength of visible light • Green vegetation actually emits more energy in the near infrared (at ~.83microns) than it does in the green visible wavelength
Thermal IR images – reveal high heat sources or output (.74microns to 300microns)
Remote Sensing Overview • Distance, time, cost, weight (gravitational escape), and danger ( radiation, loss of bone density and muscle mass for examples) make RS the only practical way for us to explore our Solar System • RS involves many different disciplines • Optics • Physics • Chemistry • Micro-electronics • Natural sciences • RS has four basic components • Energy source (usually the Sun but may be generated) • Transmission path (usually a planets atmosphere) • Target (composition, texture, grain size, etc) • Satellite sensor (type or wavelength of energy to be acquired)
Remote Sensing Overview (cont’d) • Spectral curves or reflectance • Every natural and man-made material absorbs, reflects or emits energy at different levels along the EM spectrum • These spectral curves are unique to each material (like a fingerprint) and can be used to positively identify a substance • RS instruments are designed to measure energy output a specific wavelengths or bands (can be broad or narrow) to take advantage of known EM features for materials recorded under lab conditions • These characteristic features must fall within the transmission windows for the composition of the atmosphere being observed through, otherwise they are masked by elements, gases or molecules in the atmosphere itself • Spectral curves can be used to determine bulk composition within limits dictated by all of the above
Spectral Reflectance(Spectral curves) • Blue, green & red lines indentify “bands” at which ETM instrument records reflectance levels • Instrument only “sees” reflectance level at the wavelength for each band • Combination of these 3 bands can produce a color image
Atmospheric Windows • The ability of radiation to pass through an atmosphere is called its transmissivity • Radiation is absorbed by atoms and molecules in the atmosphere • Wavelength dependant • If atoms or molecules are ~ diameter of the wavelength of the radiation it can be absorbed or scattered • If not the radiation is transmitted • Absorptions bands – diagnostic features of a spectral curve • Areas of the EMS where energy is absorbed by a material • Diagnostic or characteristic features for a particular material always found at a specific range of wavelengths • Directly related to chemistry (i.e. energy state of atoms, ions, or electrons in atomic lattice) • Atmospheric windows • Wavelengths of the EMS where energy is able to pass through the atmosphere without being absorbed– called transparent at such a wavelength
Rayleigh and Mie Scattering • Rayleigh scattering • Small molecules (O, N2) are more effective at scattering shorter wavelengths of light i.e. the sky is blue • Mie Scattering • Large molecules (H2O) scatter all visible wavelengths more or less equally • Because all wavelengths are scattered, clouds appear to be white
Atmospheric Absorption and Transmission Across the EMS for Earth • Dark = areas where energy is absorbed • Associated compounds responsible for that absorption • Grey = wavelengths where energy passes through the atmosphere
Remote Sensing Methods • Passive • Detect natural energy reflected or emitted from observed surface • Reflected sunlight is most common energy source • Camera – records visible light energy from the Sun reflected off of subject • Active • Produce or propagate energy burst or stream • Record strength or attenuation of signal • Record change in signal orientation or patterns (time) • Radar – generates microwave pulse to bounce off of target
RS Instruments • Instruments • Radiometer – quantitatively measures energy level over a broad spectrum of wavelengths (visible, microwave) • Imaging radiometer – scanning capability provides two-dimensional array of pixels from which a B&W image can be made • Spectrometer – uses prisms or gratings to disperse incident energy into discrete wavelengths so narrow bands of intensity can be measured (used over many EMS ranges to classify target composition) • Radar – transmits radio or microwave frequency pulses and measures strength of reflected signal and backscatter (time lapse can be used for distance) • Laser altimeter – uses stimulated light emissions to record reflected signal (used for highly accurate measurement of elevation of planetary surface from orbiting satellites)
Digital ImagesBits and Pixels • Binary system of counting for computers • Bits are on or off • 8 bit most common (also, 16 and 32) • DN - 256 total range of discrete integer values (0-255) • 00=0, 01=1, 10=2, 11=3….11111111=255 • Pixel – picture element, basis of digital image production • A square unit cell of a given size (e.g. 50microns) • 2-dimensional array of pixels in rows and columns each assigned an x,y coordinate • Each pixel is assigned an 8-bit value (DN) based on intensity of energy reflected to instrument at a specific wavelength • 0 = black (no reflectance) and 255 = white (saturated or total reflectance) • Put together produces a B&W image of gray tones • Pixel resolution based on focal plane of instrument and altitude above surface and defines area of target surface covered by pixel
Digital Color Images • Human eye can discern ~20 –30 gray levels or tones • Human eye can distinguish 20,000 or more color tints or hues • Digital images recorded at different wavelengths or bands have different contrasts • B&W images shot through red, green, blue light produce color images • Enables us to “see” energy levels at wavelengths other than visible light • False color images • Classification of materials based on absorption features at specific wavelengths