Download
1 / 18
180 likes | 269 Vues
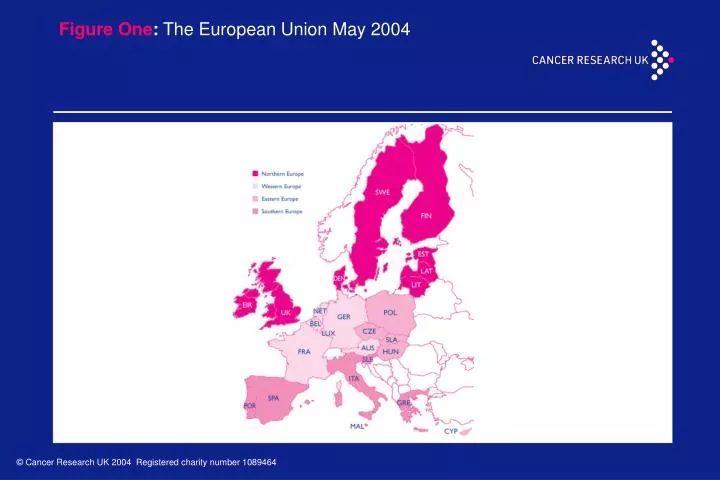
Figure One : The European Union May 2004. Table One (a) : Population measures for the countries of the European Union. Table One (b) : Population measures for the countries of the European Union.

E N D
Table One (a):Population measures for the countries of the European Union
Table One (b):Population measures for the countries of the European Union
Table Two (a): Number of new cases, deaths and five-year prevalence (2000 estimates) and age-standardised five-year relative survival (%) (patients diagnosed 1990-1994) for all cancers excluding NMSC, countries of the EU
Table Two (b):Number of new cases, deaths and five-year prevalence (2000 estimates) and age-standardised five-year relative survival (%) (patients diagnosed 1990-1994) for all cancers excluding NMSC, countries of the EU
Figure Two:All malignant neoplasms*, number of new cases and age specific rates per 100,000 population, by sex, EU, 2000 estimates * excluding non-melanoma skin cancers
Figure Three: The most commonly diagnosed cancers* in the EU, 2000 estimates * excluding non-melanoma skin cancers
Figure Four:The most common causes of death from cancer* in the EU, 2000 estimates
Figure Five (a) and (b) : Age standardised incidence rates, all cancers*, EU, 2000 estimates
Figure Six (a) and (b) : Age standardised mortality rates, all cancers*, EU, 2000 estimates
Figure Seven (a) and (b) : Age standardised incidence and mortality rates, bowel cancer, persons, EU, 2000 estimates
Figure Eight (a) and (b) : Age standardised incidence and mortality rates, breast cancer, females, EU, 2000 estimates
Figure Nine (a) and (b) : Age standardised incidence rates, lung cancer, EU, 2000 estimates
Figure Ten (a) and (b) : Age standardised incidence and mortality rates for prostate cancer, EU, 2000, estimates
Table Four:Recommendations from the European Code Against Cancer (2003)