Download
1 / 2
20 likes | 128 Vues
Supplementary Figure 1: Incidence of STEMI per 100'000 inhabitants in Canton Ticino 2004-10. Pre-Legislation. Post- Legislation. -15.10% *. -23.35% *. -24.40% *. Incidence of STEMI per 100'000 inhabitants. 2004-05. 2005-06. 2006-07. 2007-08. 2008-09. 2009-10.

E N D
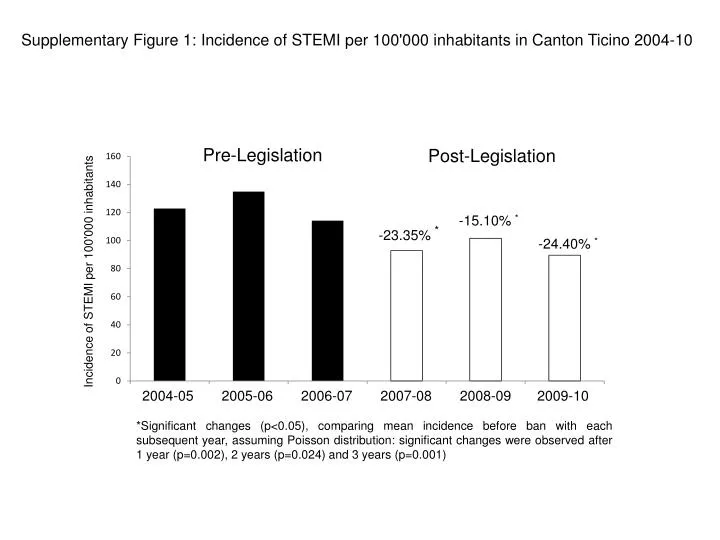
Supplementary Figure 1: Incidence of STEMI per 100'000 inhabitants in Canton Ticino 2004-10 Pre-Legislation Post-Legislation -15.10% * -23.35% * -24.40% * Incidence of STEMI per 100'000 inhabitants 2004-05 2005-06 2006-07 2007-08 2008-09 2009-10 *Significant changes (p<0.05), comparing mean incidence before ban with each subsequent year, assuming Poisson distribution: significant changes were observed after 1 year (p=0.002), 2 years (p=0.024) and 3 years (p=0.001)
Supplementary Figure 2: Incidence of STEMI per 100'000 inhabitants in Canton Basel City 2005-10 Smoking Ban in Canton Ticino 04.2007 -8.5% * -5.8% * -12.6% * Incidence of STEMI per 100'000 inhabitants 2005-06 2006-07 2007-08 2008-09 2009-10 *No significant changes were observed comparing mean incidence before the ban in Ticino with each subsequent year, assuming Poisson distribution.