Download
1 / 21
220 likes | 352 Vues
Bayesian Network Anomaly Pattern Detection for Disease Outbreaks. Weng-Keen Wong (Carnegie Mellon University) Andrew Moore (Carnegie Mellon University) Gregory Cooper (University of Pittsburgh) Michael Wagner (University of Pittsburgh). The Problem.

E N D
Bayesian Network Anomaly Pattern Detection for Disease Outbreaks Weng-Keen Wong (Carnegie Mellon University) Andrew Moore (Carnegie Mellon University) Gregory Cooper (University of Pittsburgh) Michael Wagner (University of Pittsburgh)
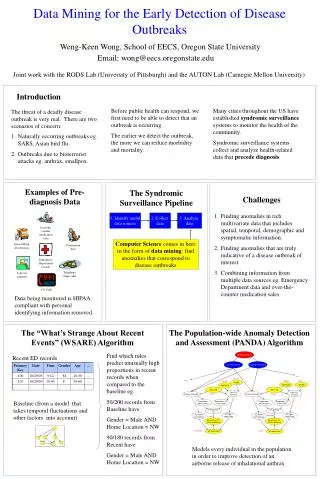
The Problem Suppose we have real-time access to Emergency Department data from hospitals around a city (with patient confidentiality preserved) From this data, can we detect if a disease outbreak is happening? How early can we detect it? The question we’re really asking: what’s strange about recent events?
Traditional Approaches What about using traditional anomaly detection? • Typically assume data is generated by a model • Finds individual data points that have low probability with respect to this model • These outliers have rare attributes or combinations of attributes • Need to identify anomalous patterns not isolated data points
Traditional Approaches What about monitoring aggregate daily counts of certain attributes? • We’ve now turned multivariate data into univariate data • Lots of algorithms have been developed for monitoring univariate data: • Time series algorithms • Regression techniques • Statistical Quality Control methods • Need to know apriori which attributes to form daily aggregates for!
Traditional Approaches What if we don’t know what attributes to monitor? What if we want to exploit the spatial, temporal and/or demographic characteristics of the epidemic to detect the outbreak as early as possible?
One Possible Approach Recent records ( from today ) Baseline records ( from 7 days ago ) Find which rules predict unusually high proportions in recent records when compared to the baseline eg. 52/200 records from “recent” have Gender = Male AND Age = Senior 90/180 records from “baseline” have Gender = Male AND Age = Senior Idea: Can use association rules to find patterns in today’s records that weren’t there in past data
Which rules do we report? • Search over all rules with at most 2 components • For each rule, form a 2x2 contingency table eg. • Perform Fisher’s Exact Test to get a p-value for each rule (call this the score) • Report the rule with the lowest score
Problem #1: Multiple Hypothesis Testing • Can’t interpret the rule scores as p-values • Suppose we reject null hypothesis when score < , where = 0.05 • For a single hypothesis test, the probability of making a false discovery = • Suppose we do 1000 tests, one for each possible rule • Probability(false discovery) could be as bad as: 1 – ( 1 – 0.05)1000 >> 0.05
Solution: Randomization Test • Take the recent cases and the baseline cases. Shuffle the date field to produce a randomized dataset called DBRand • Find the rule with the best score on DBRand.
Randomization Test Repeat the procedure on the previous slide for 1000 iterations. Determine how many scores from the 1000 iterations are better than the original score. If the original score were here, it would place in the top 1% of the 1000 scores from the randomization test. We would be impressed and an alert should be raised. Corrected p-value of the rule is: # better scores / # iterations
Problem #2: A Changing Baseline From: Goldenberg, A., Shmueli, G., Caruana, R. A., and Fienberg, S. E. (2002). Early statistical detection of anthrax outbreaks by tracking over-the-counter medication sales. Proceedings of the National Academy of Sciences (pp. 5237-5249) • Baseline is affected by temporal trends in health care data eg: • Seasonal effects in temperature and weather • Day of Week effects • Holidays • Choosing the wrong baseline distribution can affect the detection time and false positives rate
Solution: Bayesian Network All Historical Data • Learn Bayesian Network using Optimal Reinsertion [Moore and Wong 2003] Today’s Environment Baseline 2. Generate baseline given today’s environment
Environmental Attributes Divide the data into two types of attributes: • Environmental attributes: attributes that cause trends in the data eg. day of week, season, weather, flu levels • Response attributes: all other non-environmental attributes
Environmental Attributes When learning the Bayesian network structure, do not allow environmental attributes to have parents. Why? • We are not interested in predicting their distributions • Instead, we use them to predict the distributions of the response attributes Side Benefit: We can speed up the structure search by avoiding DAGs that assign parents to the environmental attributes Season Day of Week Weather Flu Level
Generate Baseline Given Today’s Environment Suppose we know the following for today: Day of Week = Monday Flu Level = High Season = Winter Weather = Snow We fill in these values for the environmental attributes in the learned Bayesian network We sample 10000 records from the Bayesian network and make this data set the baseline Baseline
What’s Strange About Recent Events (WSARE) • Obtain Recent and Baseline datasets 2. Search for rule with best score • Determine p-value of best scoring rule 4. If p-value is less than threshold, signal alert
Results on Actual ED Data from 2001 1. Sat 2001-02-13: SCORE = -0.00000004 PVALUE = 0.00000000 14.80% ( 74/500) of today's cases have Viral Syndrome = True and Encephalitic Prodome = False 7.42% (742/10000) of baseline have Viral Syndrome = True and Encephalitic Syndrome = False 2. Sat 2001-03-13: SCORE = -0.00000464 PVALUE = 0.00000000 12.42% ( 58/467) of today's cases have Respiratory Syndrome = True 6.53% (653/10000) of baseline have Respiratory Syndrome = True 3. Wed 2001-06-30: SCORE = -0.00000013 PVALUE = 0.00000000 1.44% ( 9/625) of today's cases have 100 <= Age < 110 0.08% ( 8/10000) of baseline have 100 <= Age < 110 4. Sun 2001-08-08: SCORE = -0.00000007 PVALUE = 0.00000000 83.80% (481/574) of today's cases have Unknown Syndrome = False 74.29% (7430/10001) of baseline have Unknown Syndrome = False 5. Thu 2001-12-02: SCORE = -0.00000087 PVALUE = 0.00000000 14.71% ( 70/476) of today's cases have Viral Syndrome = True and Encephalitic Syndrome = False 7.89% (789/9999) of baseline have Viral Syndrome = True and Encephalitic Syndrome = False 6. Thu 2001-12-09: SCORE = -0.00000000 PVALUE = 0.00000000 8.58% ( 38/443) of today's cases have Hospital ID = 1 and Viral Syndrome = True 2.40% (240/10000) of baseline have Hospital ID = 1 and Viral Syndrome = True
Related Work • Deviations between models induced by two datasets [Ganti, Gehrke and Ramakrishnan] • Emerging Patterns [Dong and Li] • Mining Surprising Patterns using Temporal Description Length [Chakrabarti, Sarawagi and Dom] • Contrast sets [Bay and Pazzani] • Association Rules and Data Mining in Hospital Infection Control and Public Health Surveillance [Brossette et. al.] • Spatial Scan Statistic [Kulldorff]
Conclusion • One approach to biosurveillance: one algorithm monitoring millions of signals derived from multivariate data instead of Hundreds of univariate detectors • WSARE is best used as a general purpose safety net in combination with other detectors • Careful evaluation of statistical significance • Modeling historical data with Bayesian Networks to allow conditioning on unique features of today Software: http://www.autonlab.org/