Download
1 / 12
120 likes | 204 Vues
Control Chart Methodology for Evaluating CEMS Data. Louis Nichols US EPA Clean Air Markets Division; Emissions Monitoring Branch Nichols.Louis@epa.gov. Intro.

E N D
Control Chart Methodology for Evaluating CEMS Data Louis Nichols US EPA Clean Air Markets Division; Emissions Monitoring Branch Nichols.Louis@epa.gov
Intro • Control charts are an effective tool for identifying unusual shifts in a parameter that should be fairly constant for a given operating condition • One use is to detect bias from probe leaks in dilution monitoring systems. Calibrations do not necessarily detect system leaks. • EPA reference method systems utilizing the dilution probes can have air in-leakage (harder to control-chart) – check for unexplained CO2 shifts (see previous RATAs)
EPA CO2 Control Chart Auditing • EPA runs the control chart audit on CO2 data quarterly so as to minimize in the future the amount of data that could be called into question • This audit is run in an “ad-hoc” manner after the data has been submitted to EPA. • EPA continues to refine this technique to “weed out” false positives. • EPA also looks to use this sort of auditing on other parameters as appropriate to identify questionable data
Data Used for Analysis • CAMD uses CO2 concentrations used as the control parameter given its relatively low variability in any given load band • Use normal load data – avoid start-up, shut-down, and very low loads • Avoid substitute data (part 75 only) – use method of determination code (MODC) of “01” – measured data only • Need date of completion for last CO2 RATA
Data Preparation • Identify load bin to evaluate • CAMD batch evaluation uses the most used load bin (load bin with highest % usage) • Other load bins can be evaluated as desired • Minimum Criteria for Daily Data: • CAMD discards all CO2 data for days with less than six quality assured measured values in the load bin of interest
Determining Baseline Mean and Control limits • Baseline data is compiled from the 30 calendar days following a successful CO2 RATA (more if less than 15 days meet the minimum criteria) • The following values are calculated for the baseline period: • The daily average CO2 concentration, (ACi); • The baseline mean CO2 concentration, (AAB); and • The standard deviation of the daily average CO2 values over the baseline period, (SDB) • The control limits are set based on the standard deviation of the baseline data.
Determining Control Limits • EPA uses AAB± 3 SDB as the audit level as 99.7% of the daily averages should fall within this range. • Therefore: • The upper control limit is: XUCL = AAB + 3 SDB; and • The lower control limit is: XUCL = AAB - 3 SDB • EPA recommend that sources use AAB± 2 SDB as a control warning level
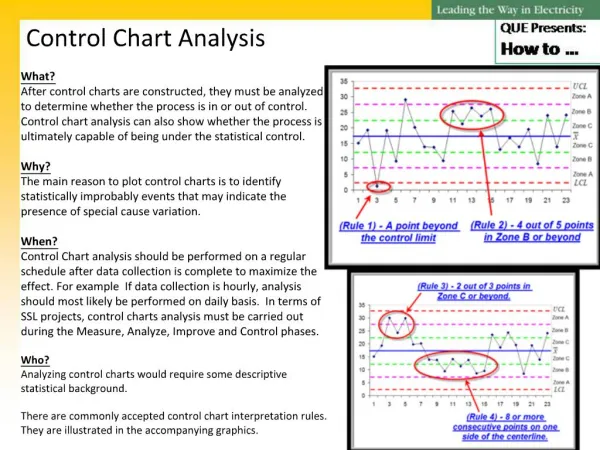
Evaluating Daily Data Against the Baseline • Compare each daily average CO2 concentration value to the calculated control limits. • Flag any day where the average CO2 value is outside of the control limits. • High and Low deviations are tracked separately • Whenever 7 or more consecutive daily averages are out-of-bounds (consistently high or low) the data for the unit is flagged as having developed a potential bias, and possible sampling system leak.
Leak Detection and Prevention of Data Loss (i.e., Avoiding the audit letter) • EPA encourages all facilities with CO2 CEMS data to follow the procedures described in this presentation to identify early any questionable data as an added QA step. • If you see the CO2 drop for more than a few days, investigate to find the cause and take appropriate action. • EPA recommends investigation at the 2 level • In such cases, consider the data validity for other parameters that might also need to be invalidated. • Document all findings.