Download
1 / 123
1.23k likes | 1.42k Vues
Pasture, Rangeland, Forage Vegetation Index Plan of Insurance . This presentation does not replace or supersede any procedures or modify any provisions contained in the complete insurance policy. Introduction and Program Overview. Introduction and Overview Science Behind the Program

E N D
Pasture, Rangeland, Forage Vegetation Index Plan of Insurance This presentation does not replace or supersede any procedures or modify any provisions contained in the complete insurance policy.
Introduction and Program Overview Introduction and Overview Science Behind the Program Program Basics Detailed Example Additional Tools and Information
Program Overview Purpose • The intent of this section: • Introduction to program and unique topics • Provide background and basic philosophy • Details of the program provided in following sections
History • History • The Agricultural Risk Protection Act of 2000 (ARPA) mandates programs to cover pasture and rangeland • Two new pilot programs approved for 2007 Crop Year • Pasture, Rangeland, Forage (PRF) – Vegetation Index • Covered in this training • Pasture, Rangeland, Forage (PRF) – Rainfall Index
Introduction • Beginning with the 2007 CY
Program Potential • Estimated acres covered by the pilot Source: 2002 Census of Agriculture for grazingland and Hayland plus 1997 Census of Agriculture data for Grazing Permit Acres for the County Data
Program Potential • Estimated program potential: • (assume: Participation = 10%, Coverage Level = 75%...) Source: 2002 Census of Agriculture for grazingland and Hayland plus 1997 Census of Agriculture data for Grazing Permit Acres for the County Data
Challenges • Crop challenges • Various plant species • Timing of plant growth • Crop continuously harvested via livestock • Lack of individual/industry data • Vast range of management practices across the industry • Publicly announced prices not available
Crop Information • Crop • (0088) Pasture, Rangeland, Forage • Crop Types • (064) Grazingland • (063) Hayland
Crop Types • Grazingland • Established acreage of forage • Intended for grazing by livestock • Acreage must be suitable for grazing
Crop Types • Hayland • Established acreage of perennial forage • Intended for haying • Acreage must be suitable for haying • Program covers all types of grazing and haying forage (i.e. not just for alfalfa)
Program Overview • GRP program • Goal – utilize an existing policy type • Capitalize on current program familiarity • Increase marketability and effectiveness • The resulting design is based on the principles of the existing GRP program
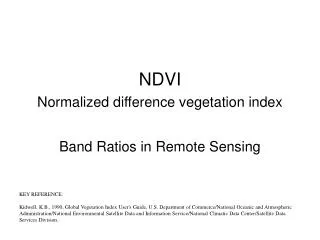
Program Overview • Index background • Lack of actual producer/industry production data • No consistent and sound methodology for measuring production for the crop • The deviation from long-term normal NDVI is used to establish the index • Crop ‘greenness’ reflectivity has a high degree of correlation to forage production
Program Overview • Index driven – EROS data (Earth Resources Observation and Science – USGS) • Primary index difference • Based on EROS data vs. NASS county yields • Reports NDVI data (Normalized Difference Vegetation Index – aka ‘greenness’) • Widely used source of NDVI information • Dependable source • Sufficient data history – since 1989 • Consistent and universal coverage through a grid system • Grid boundaries vs. county boundaries
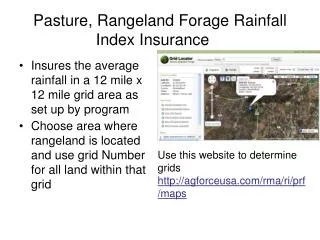
Program Overview • Area of insurance = 8 x 8 km (~4.8 x 4.8 miles)
Program Overview • Areas of insurance are grids (grids 8 x 8 km) • Grids vs. County • Grids are approximately 4.8 x 4.8 miles in size • Provides for a consistent program across the United States • Counties vary in size, but the grids do not • Grid size reduces basis risk vs. county size • Allows for closer correlation to individual experience • Grids will cross county and state lines
Program Overview • Index Intervals • Multiple Intervals offered – 4 • Crop Year divided into 4, 3-month intervals for each grid • Similar to Crop Practices • Ability for producers to manage appropriate timing risks • Correlate to individual growth patterns and production seasons • The 3-month intervals provide for greater reaction to forage reduction events vs. a yearly average
Program Overview • Index Intervals Crop Year 12 months Begins April 1st
Program Overview • Index Intervals Intervals 4, 3-month I II III IV Crop Year 12 months Begins April 1st Note: Actual dates discussed in Program Basics
Program Overview • Index Intervals • These Intervals act as ‘mini-insurance periods’ • For example, indemnities payable on one Interval are not dependent on results from other Intervals Intervals 4, 3-month I II III IV
Program Overview • Index Intervals • Minimizes dependency on subjective pre-determined forage growing seasons • Maintains consistency across the country • Allows for regional and local variances • Allows individual freedom to select appropriate intervals • Index intervals are mutually exclusive • One index does not effect the others • All rated separately
Program Overview • Index Intervals • Producers may select more than 1 interval • The purpose of the program is to insure annual forage production • Minimum amount if more than one interval is selected is 10%
Program Overview • Coverage Levels • Percentages available: 90, 85, 80, 75, and 70 • Consistent with other GRP programs • Higher coverage levels reduce basis risk • Correlates closer to individual experience • Catastrophic Risk Protection (CAT) • Not currently available • Producers are still eligible for NAP coverage
Program Overview • Rating • Each grid, index interval, and coverage level is individually rated • Minimizes adverse selection • No economic advantage of insuring in one scenario vs. another • Encourages producers to select a scenario that best mitigates their operation/production risks • Adequate data permits the individual rating • Allowing the rates to accurately reflect the risks of each scenario
Program Overview • Not required to insure 100% of acreage • Forage utilized in the annual grazing or hay cycle can be insured without insuring all acreage • All acres within a property may not be productive, e.g., rocky areas, submerged areas • Provides additional flexibility for the insured to design the coverage to his specific needs • Because the program is a group program and other programs are not available, there is no opportunity to ‘move’ production
Program Overview • Sales Closing Date: November 30 • Only one Sales Closing per year • Consistent with other programs’ SCD • Minimizes possible forecasting and program abuse • 100+ day lag to the crop year • Note: This is a change from earlier versions of the policy sent to the companies (originally set in December) – but was changed due to company feedback
Program Overview • Program supported via internet • Provides the most efficient and effective way to deliver the program • Allows access to the mapping tools • Locate grazing areas and associated Grid ID numbers • Provides access to the historical Vegetation indices • Allows access to all relevant data, materials, and tools associated with the program
Advantages • Flexibility • Covers predominant peril • Provides for timely indemnities • Index intervals are mutually exclusive • Individual loss adjustments not needed • Easily understood Index • Production records not required • Moral hazard and adverse selection minimized
Disadvantages • Individual losses/experiences not covered • Slight terminology differences from other GRP programs
Crop Biology • The program addresses forage-based production systems on land areas producing primarily perennial vegetation • Comprised of diverse plant communities and mixtures: • Perennial and annual • Warm season and cool season • Different growth habits over extended time periods
Crop Biology • Forage may be harvested directly by grazing animals, harvested for hay, or a combination of both: • Continual harvest and/or single haying • Capacity to live and reproduce from year to year • Because of the nature of forage-based systems the program is designed to insure the annual production
Program Technology • Based on the Normalized Difference Vegetation Index (NDVI) data derived from satellites observing the changes in greenness of vegetation of the earth • The plan does not explicitly predict individual forage production • It relates to the amount of vegetation on earth and the changes in greenness over time • This is correlated with forage production
Program Technology • Historical data since 1989 • Data updated every 14 days • Grids are 8km • Data collected in 1km grids – aggregated up to 8km grids • ~ 4.8 x 4.8 miles in size, and used in many other national programs
Program Technology • The Vegetation Index is derived from 2 data sources: • NDVI data from NASA and processed by EROS • NOAA gridded average daily temperature data • NDVI captures vegetation ‘greenness’ • Temperature correction for excessive hot and cold temperaturessuppressing growth even when plants are green
Terminology and Other Differences • Grid and Grid ID versus County • Insurable and Insured acres versus Planted acres • Index versus Yields • Accumulative NDVI based grid index versus NASS county yield index • The program is web based • No CAT coverage offered at this time • Not required to insure 100% of acres • Grid IDs, crop types, and index intervals will be determined prior to the Sales Closing Date
Basic Definitions • County: may also include any acreage within a grid ID that crosses an adjoining county or state line where the acreage is contiguous
Basic Definitions • Insurable Acreage:Hayland and grazingland that is not planted annually • Overseeding into acreage of existing forage crops is acceptable • Annually planted crops currently not insurable • Insurable acres will consist of the total number of acres suitable for insurance under these crop provisions • Includes both insured acres and uninsured acres
Basic Definitions • Insured Acres:The number of insurable acres selected to be insured by a producer • May choose to insure either Grazingland, Hayland, or both • Not required to insure 100% of the crop type(s) • If the insured chooses to insure the crop types under this policy they cannot insure the same crop under any other FCIC subsidized program
Basic Definitions • Unit: The insured acres within or assigned to a grid ID for each crop type, and index interval • If there are multiple Grid IDs on a policy the index values are not added together, each unit and crop stands on its own • Basic Units only – no basic unit discount
Basic Definitions • County Base Value:established production value of grazingland and hayland forage • Only one value per county for each crop type • Does not include GRP 1.5 multiplier • Productivity Factor: A percentage multiplier allowing the insured to individualize coverage based on their individual crop productivity • Insured selects between 60 and 150% • Concept is the same as ‘price election’ in other GRP policies • Only one productivity factor may be selected per county and crop type
Basic Definitions • Dollar Amount of Protection per Acre:The county base value (CBV) per acre, multiplied by the productivity factor (PF) (60% - 150%), multiplied by the coverage level (CL) (70% - 90%) EXAMPLE: $17.65 (CBV) x 1.20 (PF) x 0.85 (CL)= $18.00per Acre • Only one dollar amount of protection per acre for each county and crop type
Basic Definitions • Policy Protection per Unit:Dollar amount of protection per acre, multiplied by the insured acres, multiplied by the producer’s share of the unit for each grid EXAMPLE: $ Amount of Protection/ac = $18.00, Insured Acres = 1,000, Share = 100%, 50% Interval II, 50% Interval III For: Index Interval II: $18.00 x 500 ac x 100% (share) = $9,000 Index Interval III: $18.00 x 500 ac x 100% (share) = $9,000 • PolicyProtection: The sum of the policy protection per units ($18,000)
Program Dates • Crop Year: April 01 – March 31 • Sales Closing Date: November 30 (crop type, dollar amount of protection per acre, coverage, Grid ID, index intervals, and items relevant to acreage report) • Acreage Reporting Date: November 30 • Contract Change Date: August 31 • Premium Billing Date: October 01
Program Dates 11/30 Sales Closing / Acreage Reporting 04/01 Start of Crop Year 10/01 Premium Billing 03/31 End of Crop Year 08/31 Contract Change
Coverage • CAT • Coverage currently not available • Coverage Levels • 70, 75, 80, 85, or 90% • only one coverage level for each of the insured crop types in the county • Consistent with other GRP RBUP