Download
1 / 63
870 likes | 3.25k Vues
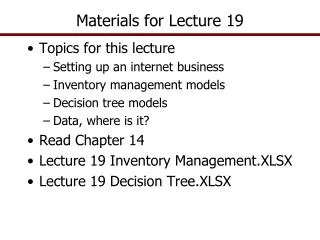
CHAPTER 15: INVENTORY MODELS. Outline Deterministic models The Economic Order Quantity (EOQ) model Sensitivity analysis A price-break Model Probabilistic Inventory models Single-period inventory models A fixed order quantity model A fixed time period model. Inventory Decision Issues.

E N D
CHAPTER 15: INVENTORY MODELS Outline • Deterministic models • The Economic Order Quantity (EOQ) model • Sensitivity analysis • A price-break Model • Probabilistic Inventory models • Single-period inventory models • A fixed order quantity model • A fixed time period model
Inventory Decision Issues • Demand of various items • Money tied up in the inventory • Cost of storage space • Insurance expense - risk of fire, theft, damage • Order processing costs • Loss of profit due to stock outs
Inventory Decision Questions How Much? When?
THE EOQ MODEL Demand rate Order qty, Q Inventory Level Reorder point, R Lead time Lead time 0 Time Order Placed Order Received Order Placed Order Received
The EOQ Model Cost Curves Slope = 0 Annual cost ($) Total Cost Minimum total cost Holding Cost = HQ/2 Ordering Cost = SD/Q Optimal order Q* Order Quantity, Q
EOQ Cost Model D - annual demand Q - order quantity S - cost of placing order H - annual per-unit holding cost Ordering cost = SD/Q Holding cost = HQ/2 Total cost = SD/Q + HQ/2
Example 1: R & B beverage company has a soft drink product that has a constant annual demand rate of 3600 cases. A case of the soft drink costs R & B $3. Ordering costs are $20 per order and holding costs are 25% of the value of the inventory. R & B has 250 working days per year, and the lead time is 5 days. Identify the following aspects of the inventory policy: a. Economic order quantity
b. Reorder point c. Cycle time
Some Important Characteristics of the EOQ Cost Function • At EOQ, the annual holding cost is the same as annual ordering cost.
Some Important Characteristics of the EOQ Cost Function • The total cost curve is flat near EOQ • So, the total cost does not change much with a slight change in the order quantity (see the total cost curve and the example on sensitivity)
EOQ WITH PRICE BREAKS • Assumptions • Demand occurs at a constant rate of D items per year. • Ordering Cost is $S per order. • Holding Cost is $H = $CiI per item in inventory per year (note holding cost is based on the cost of the item, Ci). • Purchase Cost is $C1 per item if the quantity ordered is between 0 and x1, $C2 if the order quantity is between x1 and x2, etc. • Delivery time (lead time) is constant.
EOQ with Price Breaks Formulae • Formulae • Optimal order quantity: the procedure for determining Q* will be demonstrated • Number of orders per year: D/Q* • Time between orders (cycle time): Q*/D years • Total annual cost: [(1/2)Q*H] + [DS/Q*] + DC (holding + ordering + purchase)
EOQ with Price Breaks Procedure Steps 1. Determine the largest (cheapest) feasible EOQ value: The most efficient way to do this is to compute the EOQ for the lowest price first, and continue with the next higher price. Stop when the first EOQ value is feasible (that is, within the correct interval). 2. Compare the costs: Compare the value of the average annual cost at the largest feasible EOQ and at all of the price breakpoints that are greater than the largest feasible EOQ. The optimal Q is the point at which the average annual cost is a minimum.
Example 2: Nick's Camera Shop carries Zodiac instant print film. The film normally costs Nick $3.20 per roll, and he sells it for $5.25. Nick's average sales are 21 rolls per week. His annual inventory holding cost rate is 25% and it costs Nick $20 to place an order with Zodiac. If Zodiac offers a 7% discount on orders of 400 rolls or more and a 10% discount for 900 rolls or more, determine Nick's optimal order quantity.
D = 21(52) = 1092; H = .25(Ci); S = 20 Step 1: Determine the largest (cheapest) feasible EOQ
Step 2: Compare the costs Compute the total cost for the most economical, feasible order quantity in each price category for which a was computed.
PROBABILISTIC MODELS Outline • Probabilistic inventory models • Single- and multi- period models • A single-period model with uniform distribution of demand • A single-period model with normal distribution of demand
Probabilistic Inventory Models • The demand is not known. Demand characteristics such as mean, standard deviation and the distribution of demand may be known. • Stockout cost: The cost associated with a loss of sales when demand cannot be met. For example, if an item is purchased at $1.50 and sold at $3.00, the loss of profit is $3.00-1.50 = $1.50 for each unit of demand not fulfilled.
Single- and Multi- Period Models • The classification applies to the probabilistic demand case • In a single-period model, the items unsold at the end of the period is not carried over to the next period. The unsold items, however, may have some salvage values. • In a multi-period model, all the items unsold at the end of one period are available in the next period. • In the single-period model and in some of the multi-period models, there remains only one question to answer: how much to order.
SINGLE-PERIOD MODEL • Computer that will be obsolete before the next order • Perishable product • Seasonal products such as bathing suits, winter coats, etc. • Newspaper and magazine
Trade-offs in a Single-Period Models Loss resulting from the items unsold ML= Purchase price - Salvage value Profit resulting from the items sold MP= Selling price - Purchase price Trade-off Given costs of overestimating/underestimating demand and the probabilities of various demand sizes how many units will be ordered?
Consider an order quantity Q Let P = probability of selling all the Q units = probability (demandQ) Then, (1-P) = probability of not selling all the Q units We continue to increase the order size so long as
Decision Rule: Order maximum quantity Q such that where P = probability (demandQ)
Text Problem 21, Chapter 15: Demand for cookies: DemandProbability of Demand 1,800 dozen 0.05 2,000 0.10 2,200 0.20 2,400 0.30 2,600 0.20 2,800 0.10 3,000 0,05 Selling price=$0.69, cost=$0.49, salvage value=$0.29 a. Construct a table showing the profits or losses for each possible quantity b. What is the optimal number of cookies to make? c. Solve the problem by marginal analysis.
Sample computation for order quantity = 2200: Expected number sold=1800(0.05)+2000(0.10)+2200(0.85) =2160 Revenue from sold items=2160(0.69)=$1490.4 Revenue from unsold items=(2200-2160)(0.29)=$11.6 Total revenue=1490.4+11.6=$1502 Cost=2200(0.49)=$1078 Profit=1502-1078=$424
Solution by marginal analysis: Order maximum quantity, Q such that Demand, QProbability(demand)Probability(demandQ), p
Demand Characteristics Suppose that the historical sales data shows: QuantityNo. Days sold QuantityNo. Days sold 14 1 21 11 15 2 22 9 16 3 23 6 17 6 24 3 18 9 25 2 19 11 26 1 20 12
Demand Characteristics Mean = 20 Standard deviation = 2.49
Example 3: The J&B Card Shop sells calendars. The once-a-year order for each year’s calendar arrives in September. The calendars cost $1.50 and J&B sells them for $3 each. At the end of July, J&B reduces the calendar price to $1 and can sell all the surplus calendars at this price. How many calendars should J&B order if the September-to-July demand can be approximated by a. uniform distribution between 150 and 850
Solution to Example 3: Loss resulting from the items unsold ML= Purchase price - Salvage value = Profit resulting from the items sold MP= Selling price - Purchase price =
P = Now, find the Q so that P(demandQ)= Q* =
Example 4: The J&B Card Shop sells calendars. The once-a-year order for each year’s calendar arrives in September. The calendars cost $1.50 and J&B sells them for $3 each. At the end of July, J&B reduces the calendar price to $1 and can sell all the surplus calendars at this price. How many calendars should J&B order if the September-to-July demand can be approximated by b. normal distribution with = 500 and =120.
Solution to Example 4: ML=$0.50, MP=$1.50 (see example 3) P = Now, find the Q so that P =
We need z corresponding to area = From Appendix D, p. 780 z = Hence, Q* = + z =
Example 5: A retail outlet sells a seasonal product for $10 per unit. The cost of the product is $8 per unit. All units not sold during the regular season are sold for half the retail price in an end-of-season clearance sale. Assume that the demand for the product is normally distributed with = 500 and = 100. a. What is the recommended order quantity? b. What is the probability of a stockout? c. To keep customers happy and returning to the store later, the owner feels that stockouts should be avoided if at all possible. What is your recommended quantity if the owner is willing to tolerate a 0.15 probability of stockout? d. Using your answer to part c, what is the goodwill cost you are assigning to a stockout?
Solution to Example 5: a. Selling price=$10, Purchase price=$8 Salvage value=10/2=$5 MP =10 - 8 = $2, ML = 8-10/2 = $3 Order maximum quantity, Q such that Now, find the Q so that P = 0.6 or, area (2)+area (3) = 0.6 or, area (2) = 0.6-0.5=0.10
Find z for area = 0.10 from the standard normal table given in Appendix D, p. 736 z = 0.25 for area = 0.0987, z = 0.26 for area = 0.1025 So, z = 0.255 (take -ve, as P = 0.6 >0.5) for area = 0.10 So, Q*=+z =500+(-0.255)(100)=474.5 units. b. P(stockout) = P(demandQ) = P = 0.6 c. P(stockout)=Area(3)=0.15 From Appendix D, find z for Area (2) = 0.5-0.15=0.35
z = 1.03 for area = 0.3485 z = 1.04 for area = 0.3508 So, z = 1.035 for area = 0.35 So, Q*=+z =500+(1.035)(100)=603.5 units. d.P=P(demandQ)=P(stockout)=0.15 For a goodwill cost of g MP =10 - 8+g = 2+g, ML = 8-10/2 = 3 Now, solve g in p = Hence, g=$15.
MULTI-PERIOD MODELS Outline • A fixed order quantity model • A fixed time period model
A FIXED ORDER QUANTITY MODEL Purchase-order can be placed at any time On-hand inventory count is known always Lead time for a high speed modem is two weeks and it has the following sales history in the last 25 weeks: Quantity/Week Frequency 75-80 1 70-75 3 65-70 9 60-65 8 55-60 4 Will you order now if number of items on hand is: a. 200 b. 150 c. 100
A Fixed Order Quantity Model • The same quantity, Q is ordered when inventory on hand reaches a reorder point, R
A Fixed Order Quantity Model • An order quantity of EOQ works well • If demand is constant, reorder point is the same as the demand during the lead time. • If demand is uncertain, reorder point is usually set above the expected demand during the lead time • Reorder point = Expected demand + Safety stock
Safety Stock Quantity Expected demand during lead time Reorder Point Safety stock Time Lead Time
Trade-Off with Safety Stock • Safety Stock- Stock held in excess of expected demand to protect against stockout during lead time. Safety stock Holding cost Stockouts Safety stock Holding cost Stockouts
Acceptable Level of Stockout Ask the manager!! Acceptable level of stockout reflects management’s tolerance A related term is service level. Example: if 20 orders are placed in a year and management can tolerate 1 stockout in a year, acceptable level of stockout = 1/20 = 0.05 = 5% and the service level = 1- 0.05 = 0.95.