Download
1 / 1
10 likes | 81 Vues
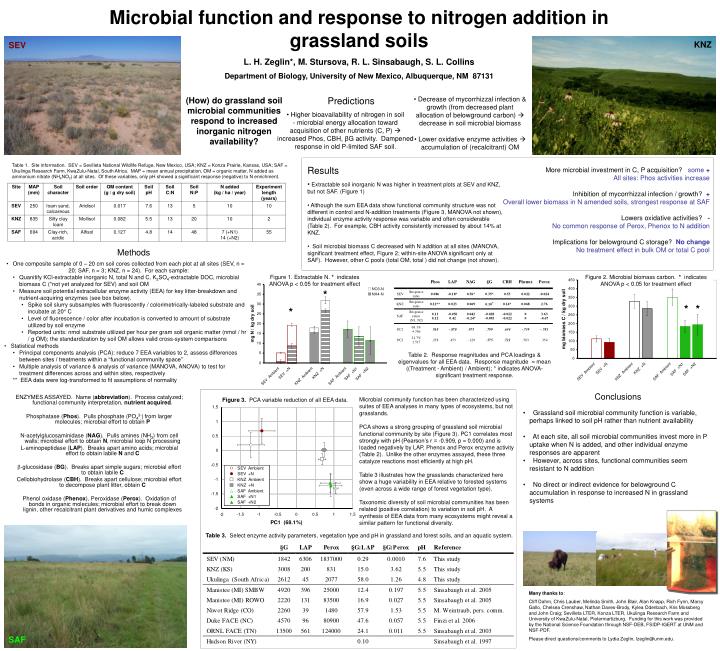
Microbial function and response to nitrogen addition in grassland soils L. H. Zeglin*, M. Stursova, R. L. Sinsabaugh, S. L. Collins Department of Biology, University of New Mexico, Albuquerque, NM 87131. KNZ. SEV.

E N D
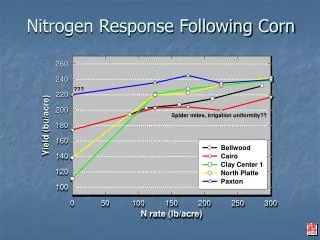
Microbial function and response to nitrogen addition in grassland soils L. H. Zeglin*, M. Stursova, R. L. Sinsabaugh, S. L. Collins Department of Biology, University of New Mexico, Albuquerque, NM 87131 KNZ SEV (How) do grassland soil microbial communities respond to increased inorganic nitrogen availability? • Higher bioavailability of nitrogen in soil- microbial energy allocation toward acquisition of other nutrients (C, P) increased Phos, CBH, βG activity. Dampened response in old P-limited SAF soil. Predictions • Decrease of mycorrhizzal infection & growth (from decreased plant allocation of belowground carbon) decrease in soil microbial biomass • Lower oxidative enzyme activities accumulation of (recalcitrant) OM Table 1. Site information. SEV = Sevilleta National Wildlife Refuge, New Mexico, USA; KNZ = Konza Prairie, Kansas, USA; SAF = Ukulinga Research Farm, KwaZulu-Natal, South Africa. MAP = mean annual precipitation, OM = organic matter, N added as ammonium nitrate (NH4NO3) at all sites. Of these variables, only pH showed a significant response (negative) to N enrichment. • Results • Extractable soil inorganic N was higher in treatment plots at SEV and KNZ, but not SAF. (Figure 1) • Although the sum EEA data show functional community structure was not different in control and N-addition treatments (Figure 3, MANOVA not shown), individual enzyme activity response was variable and often considerable (Table 2). For example, CBH activity consistently increased by about 14% at KNZ. • Soil microbial biomass C decreased with N addition at all sites (MANOVA, significant treatment effect, Figure 2; within-site ANOVA significant only at SAF). However, other C pools (total OM, total ) did not change (not shown). • More microbial investment in C, P acquisition? some+ • All sites: Phos activities increase • Inhibition of mycorrhizzal infection / growth? + • Overall lower biomass in N amended soils, strongest response at SAF • Lowers oxidative activities? - • No common response of Perox, Phenox to N addition • Implications for belowground C storage?No change • No treatment effect in bulk OM or total C pool Methods • One composite sample of 0 – 20 cm soil cores collected from each plot at all sites (SEV, n = 20; SAF, n = 3; KNZ, n = 24). For each sample: • Quanitify KCl-extractable inorganic N, total N and C, K2SO4-extractable DOC, microbial biomass C (*not yet analyzed for SEV) and soil OM • Measure soil potential extracellular enzyme activity (EEA) for key litter-breakdown and nutrient-acquiring enzymes (see box below). • Spike soil slurry subsamples with fluorescently / colorimetrically-labeled substrate and incubate at 20° C • Level of fluorescence / color after incubation is converted to amount of substrate utilized by soil enzyme • Reported units: nmol substrate utilized per hour per gram soil organic matter (nmol / hr / g OM); the standardization by soil OM allows valid cross-system comparisons • Statistical methods • Principal components analysis (PCA): reduce 7 EEA variables to 2, assess differences between sites / treatments within a “functional community space” • Multiple analysis of variance & analysis of variance (MANOVA, ANOVA) to test for treatment differences across and within sites, respectively • ** EEA data were log-transformed to fit assumptions of normality Figure 1. Extractable N. * indicates ANOVA p < 0.05 for treatment effect Figure 2. Microbial biomass carbon. * indicates ANOVA p < 0.05 for treatment effect * * * * Table 2. Response magnitudes and PCA loadings & eigenvalues for all EEA data. Response magnitude = mean ((Treatment - Ambient) / Ambient); * indicates ANOVA-significant treatment response. Conclusions • ENZYMES ASSAYED. Name (abbreviation). Process catalyzed; functional community interpretation, nutrient acquired. • Phosphatase (Phos). Pulls phosphate (PO43-)from larger molecules; microbial effort to obtain P • N-acetylglucosaminidase (NAG). Pulls amines (NH3) from cell walls; microbial effort to obtain N, microbial loop N processing • L-aminopeptidase (LAP). Breaks apart amino acids; microbial effort to obtain labile N and C • -glucosidase (BG). Breaks apart simple sugars; microbial effort to obtain labile C • Cellobiohydrolase (CBH). Breaks apart cellulose; microbial effort to decompose plant litter, obtain C • Phenol oxidase (Phenox), Peroxidase (Perox). Oxidation of bonds in organic molecules; microbial effort to break down lignin, other recalcitrant plant derivatives and humic complexes Microbial community function has been characterized using suites of EEA analyses in many types of ecosystems, but not grasslands. PCA shows a strong grouping of grassland soil microbial functional community by site (Figure 3). PC1 correlates most strongly with pH (Pearson’s r = -0.909, p = 0.000) and is loaded negatively by LAP, Phenox and Perox enzyme activity (Table 2). Unlike the other enzymes assayed, these three catalyze reactions most efficiently at high pH. Table 3 illustrates how the grasslands characterized here show a huge variability in EEA relative to forested systems (even across a wide range of forest vegetation type). Taxonomic diversity of soil microbial communities has been related (positive correlation) to variation in soil pH. A synthesis of EEA data from many ecosystems might reveal a similar pattern for functional diversity. Figure 3. PCA variable reduction of all EEA data. • Grassland soil microbial community function is variable, perhaps linked to soil pH rather than nutrient availability • At each site, all soil microbial communities invest more in P uptake when N is added, and other individual enzyme responses are apparent • However, across sites, functional communities seem resistant to N addition • No direct or indirect evidence for belowground C accumulation in response to increased N in grassland systems Table 3. Select enzyme activity parameters, vegetation type and pH in grassland and forest soils, and an aquatic system. Many thanks to: Cliff Dahm, Chris Lauber, Melinda Smith, John Blair, Alan Knapp, Rich Fynn, Marcy Gallo, Chelsea Crenshaw, Nathan Daves-Brody, Kylea Odenbach, Kris Mossberg and John Craig; Sevilleta LTER, Konza LTER, Ukulinga Research Farm and University of KwaZulu-Natal, Pietermartizburg. Funding for this work was provided by the National Science Foundation through NSF-DEB, FSIDP-IGERT at UNM and NSF-PDF. Please direct questions/comments to Lydia Zeglin, lzeglin@unm.edu. SAF