Download
1 / 1
20 likes | 160 Vues
Smart-Grid: Power Distribution and Monitoring Application Cheryl Limas , Daniel Rendon, Advisor – Dr. David Wetz, Advisor – Gregory Turner Department of Electrical Engineering, The University of Texas at Arlington, Arlington, Texas 76019

E N D
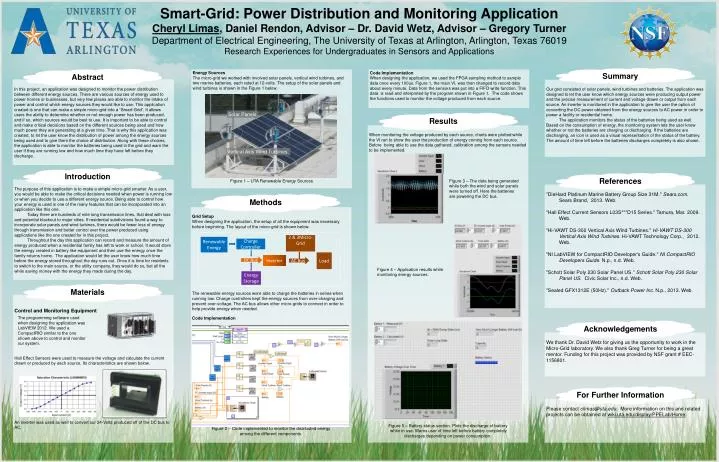
Smart-Grid: Power Distribution and Monitoring Application Cheryl Limas, Daniel Rendon, Advisor – Dr. David Wetz, Advisor – Gregory Turner Department of Electrical Engineering, The University of Texas at Arlington, Arlington, Texas 76019 Research Experiences for Undergraduates in Sensors and Applications Summary Abstract Energy Sources The micro-grid we worked with involved solar panels, vertical wind turbines, and two marine batteries, each rated at 12-volts. The setup of the solar panels and wind turbines is shown in the Figure 1 below. Figure 1 – UTA Renewable Energy Sources Code Implementation When designing the application, we used the FPGA sampling method to sample data once every 100us. Figure 1, the main VI, was then changed to record data about every minute. Data from the sensors was put into a FIFO write function. This data is read and interpreted by the program shown in Figure 1. The code shows the functions used to monitor the voltage produced from each source. Our grid consisted of solar panels, wind turbines and batteries. The application was designed to let the user know which energy sources were producing output power and the precise measurement of current and voltage drawn or output from each source. An inverter is monitored in the application to give the user the option of converting the DC power obtained from the energy sources to AC power in order to power a facility or residential home. The application monitors the status of the batteries being used as well. Based on the consumption of energy, the monitoring system lets the user know whether or not the batteries are charging or discharging. If the batteries are discharging, an icon is used as a visual representation of the status of the battery. The amount of time left before the batteries discharges completely is also shown. In this project, an application was designed to monitor the power distribution between different energy sources. There are various sources of energy used to power homes or businesses, but very few places are able to monitor the intake of power and control which energy sources they would like to use. This application created is one that can make a simple micro-grid into a “Smart-Grid”. It allows users the ability to determine whether or not enough power has been produced, and if so, which sources would be best to use. It is important to be able to control and make critical decisions based on the different sources being used and how much power they are generating at a given time. That is why this application was created, to let the user know the distribution of power among the energy sources being used and to give them the choice of distribution. Along with these choices, the application is able to monitor the batteries being used in the grid and warn the user if they are running low and how much time they have left before they discharge. Results When monitoring the voltage produced by each source, charts were plotted while the VI ran to show the user the production of energy coming from each source. Before being able to use the data gathered, calibration among the sensors needed to be implemented. Figure 5 – Battery status section. Plots the discharge of battery while in use. Warns user of time left before battery completely discharges depending on power consumption. Introduction References Figure 3 – The data being generated while both the wind and solar panels were turned off. Here the batteries are powering the DC bus. The purpose of this application is to make a simple micro-grid smarter. As a user, you would be able to make the critical decisions needed when power is running low or when you decide to use a different energy source. Being able to control how your energy is used is one of the many features that can be incorporated into an application like this one. Today there are hundreds of mile long transmission lines, that deal with loss and potential blackout to major cities. If residential subdivisions found a way to incorporate solar panels and wind turbines, there would be fewer loss of energy through transmission and better control over the power produced using applications like the one created for in this project. Throughout the day this application can record and measure the amount of energy produced when a residential family has left to work or school. It would store the energy created in battery like equipment and then use the energy once the family returns home. The application would let the user know how much time before the energy stored throughout the day runs out. Once it is time for residents to switch to the main source, or the utility company, they would do so, but all the while saving money with the energy they made during the day. "DieHard Platinum Marine Battery Group Size 31M." Sears.com. Sears Brand, 2013. Web. "Hall Effect Current Sensors L03S***D15 Series." Tamura, Mar. 2009. Web. "Hi-VAWT DS-300 Vertical Axis Wind Turbines." Hi-VAWT DS-300 Vertical Axis Wind Turbines. Hi-VAWT Technology Corp., 2012. Web. "NI LabVIEW for CompactRIO Developer's Guide." NI CompactRIO Developers Guide. N.p., n.d. Web. "Schott Solar Poly 230 Solar Panel US." Schott Solar Poly 230 Solar Panel US. Civic Solar Inc., n.d. Web. "Sealed GFX1312E (50Hz)." Outback Power Inc. N.p., 2013. Web. Methods Grid Setup When designing the application, the setup of all the equipment was necessary before beginning. The layout of the micro-grid is shown below. The renewable energy sources were able to charge the batteries in series when running low. Charge controllers kept the energy sources from over-charging and prevent over-voltage. The AC bus allows other micro-grids to connect in order to help provide energy when needed. Code Implementation Figure 2 – Code implemented to monitor the distributed energy among the different components. Solar Panels Vertical Axis Wind Turbines Figure 4– Application results while monitoring energy sources. Materials Control and Monitoring Equipment Hall Effect Sensors were used to measure the voltage and calculate the current drawn or produced by each source. Its characteristics are shown below. An inverter was used as well to convert our 24-Volts produced off of the DC bus to AC. The programming software used when designing the application was LabVIEW 2012. We used a CompactRIO similar to the one shown above to control and monitor our system. Acknowledgements We thank Dr. David Wetz for giving us the opportunity to work in the Micro-Grid laboratory. We also thank Greg Turner for being a great mentor. Funding for this project was provided by NSF grant # EEC-1156801. 2 & 3Micro-Grid Renewable Energy Charge Controller Load Inverter DC Bus AC Bus Energy Storage For Further Information Please contact climas@uta.edu. More information on this and related projects can be obtained at wiki.uta.edu/display/PPELab/Home.