Download
1 / 159
1.66k likes | 1.84k Vues
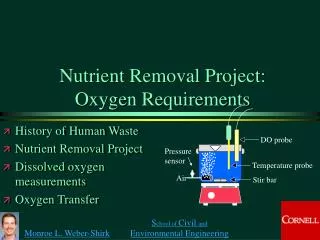
Nutrient issues, Reduction and removal. AMMONIA. Nitrogen Removal Needs. Environmental protection Meet limits Mostly done thru normal treatment that is running perfectly Your treatment will use up all the nitrogen (ammonia) that comes into your plant naturally through biological means

E N D
Nitrogen Removal Needs • Environmental protection • Meet limits • Mostly done thru normal treatment that is running perfectly • Your treatment will use up all the nitrogen (ammonia) that comes into your plant naturally through biological means • Additional treatment is necessary if loadings are high in nitrogenous compounds
Optimize for Nitrogen treatment • Nitrification is conversion of ammonia, NH3-N (from influent) to nitrate • Denitrificaton converts NO3-N to nitrogen gas, N2 • Nitrification is ammonia removal • Denitrification is nitrate removal • Since nitrogen gas is stripped off, denitrification is total nitrogen removal • Bugs necessary for the removal are typically present in MLSS
Optimize for nitrogen treatment • 1.1 pounds of oxygen per pound BOD (conventional) • 4.6 pounds of oxygen per pound of ammonia • The bacteria responsible for nitrification reproduce at a much slower rate than those responsible for BOD removal • Thus, the danger always exists for the "wash out" of the nitrifying organisms • Unless the nitrifying bacteria reproduce at the same or greater rate than they are removed from the system (by waste sludge) then the population of bacteria will be insufficient to carry out nitrification • For this reason, nitrification systems are operated at higher return sludge rates than conventional secondary treatment • The amount of sludge to be wasted is significantly less than from a conventional activated sludge system.
Optimize for Nitrogen treatment • Nitrification systems are sensitive to pH variation • Optimum pH has been found to be approximately 7.8 to 9.0 • Alkalinity is also destroyed during nitrification • Theoretically, 7.2 pounds of alkalinity are destroyed in converting 1 pound of ammonia to nitrate • In low alkalinity wastewaters, Quick lime (CaO) or Ca(OH)2 is often used to provide alkalinity and pH control
Optimize for Nitrogen treatment • Incomplete nitrification, or partial nitrification, can result in higher levels of ammonia carrying over to the clarifier • Ammonia bubbles form and float to the surface, carrying along sludge • Ashing • This leads to sludge going over the weir and is seen as a BOD increase
Optimize for Nitrogen treatment • In order for denitrification to occur, a carbon source must be available • Most commonly, methanol is used • The methanol must be added in sufficient quantity to provide for cell growth and to consume any dissolved oxygen which may be carried into the denitrification reactor. • Usually 3 to 4 pounds of methanol per pound of nitrate are required • Careful control of methanol feed is necessary to prevent waste of chemicals
Optimize for Nitrogen treatment • Denitrifying bacteria grow very slowly and are extremely sensitive to temperature. • Denitrification rates have been shown to increase five-fold when the temperature is increased from 10°C to 20°C • Operating parameters such as sludge age and retention time must be varied with temperature.
Nitrogen Removal and DO • Denitrification can only occur after nitrification (nitrification produces nitrates) • Denitrification only occurs in environments devoid of oxygen but where nitrates are present • A source of carbon must also be present • Carbon can be in the form of BOD
Benefits • Denitrification saves energy costs • During denitrification, part of BOD removal will occur without DO • Denitrification also restores alkalinity which is necessary for other processes in treatment
How to Do It • Creating an anoxic place in a carousel basin is fairly easy • Aerate basin at a level that takes care of your BOD and ammonia oxidation…but not in excess • Trial and error to find this point, but monitor basin to find an area that has a very low DO (<0.5 mg/L)
What It Looks Like Area of Higher DO DO Depletes as flow Travels down channels Anoxic zone RAS Area of Lower DO Effluent
Monitoring • Monitoring DO around the basin can target the anoxic area • Changing aeration can move anoxic areas towards effluent discharges or weirs • Misconception is that DO has to be 1.0 to 2.0 mg/L • DO goes down as water moves down the channel, therefore a lower DO is seen in areas just before aeration zones
Particulars • NaOH used for pH adjustment and alkalinity • Alum dosed into post anoxic zone for phosphorus precipitation • Methanol could be dosed into post anoxic zone for more nitrogen removal
Particulars • All influents go thru anoxic zone for nitrogen removal • This system has reached 3.1 mg/L nitrogen consistently
Particulars • Alum and NaOH dosed in influent for alkalinity and pH control • Uses turbine aerators for aeration, modified (by slowing down) to use as mixers • Resulting separation of anoxic/ aerobic zones provides 0.6 mg/L ammonia consistently
Ammonia Procedure • Make sure meter is warmed up! • 1. Pour out 50 or 100 mL of sample. • 2. Place the electrode in the beaker. • 3. Turn on the magnetic stirrer. • 4. Set the meter to begin reading • 5. Add 1 ml or 2 ml of buffer solution (typically 10 M NaOH) whichever is called for. • (Orion buffer stays blue if the sample pH is > 11) • 6. Read millivolts and concentration (if using onboard software).
Ammonia Procedure Keep the electrode at an angle to minimize air bubbles Stir at the same speed for standards and samples. Prevent heating the solution; insulate between beaker & stirrer Do not add NaOH before immersing electrode --ammonia is in gaseous form at this pH and will be lost!
Ammonia procedure • ..\Lab transfer\Ammonia benchsheet New NR149 98.xls
Ammonia procedure Probe, Probe, Probe! • Probes do NOT last forever! • Average life expectancy is 2 years or less. • If your probe is > 2 yrs old, consider getting a new one • DO NOT store probes in lab reagent water! • Your probe will be deader than the proverbial doornail. • DO store the probe in 1000 ppm NH4Cl solution • AVOID calibrating below about 0.2 mg/L! • It takes longer to stabilize than meter pre-set timer. • Result will often be a poor slope or bias at the low end Probes now cost around $550
New Ammonia procedure • Method calibrates like phosphorus • Calibrate once per yeaer • Analyze CCV/LCS, Blank and samples • Fully accepted by DNR • Costs around $45 for 25 vials • $1.80 per test • If you test 3 times per week=$9.00 • $468 per year • Savings is in time, ease and accuracy
Nutrient issues, Reduction and removal PHOSPHORUS
Updates • What do we know for sure
Background • DNR Bureau of Watershed Management has proposed new phosphorus criteria for rivers and streams into NR 102.6 • Criteria is now 100 ug/L (0.1 mg/L) for listed rivers • 75 ug/L (0.075 mg/L) for all other streams, unless exempted • Limits for Lake Superior is 5 ug/L (0.005 mg/L)
Background • 46 Listed streams: • Bad River from confluence w/Marengo River w/I Bad River Res. Downstream to L. Superior • Chippewa River from L. Chippewa in Sawyer county downstream to Mississippi River, excluding Holcombe, Cornell Old Abe L. Wissota and Dells Pond • Flambeau River from Turtle-Flambeau in Iron county to Chippewa River, excluding Pixley, Crowley, Dairyland flowages
Background • 46 Listed streams: • Jump River confluence w/ North Fork & South Fork of Jump River in Price County to Holcombe Flowage • Namekagon River from outlet of Trego Lake to St. Croix River • Red Cedar River from Confluence w/Brill River, excluding Rice, Tainter, Menomin • St. Croix River from confluence w/Namekagen River downstream to Miss. River, excluding Lake St. Croix near Hudson
Background • 46 Listed streams: • St. Louis River from state line to the opening between Minnesota Point and Wisconsin Point at Lake Superior • S. fork of Flambeau River from HWY 13 near Fifield to Flambeau River • Tomahawk River from outlet of Willow Reservoir to L. Nokomis • White River from outlet of White River Flowage in Ashland county to Bad River
Hearings • Support from: • Lakes and river associations • Environmental groups • Individuals who want strong rules limiting phos inputs into lakes & streams • Lakeshore property owners, small businesses municipalities that depend on tourism • Opposition: • Municipalities • Paper industries • Dairy farmers
Comments and Responses • Basically, the DNR is stuck because 7 groups of “environmentalists” are threatening to sue EPA if they do not set these limits. • Clean Water Action Council of North East Wisconsin • Gulf Restoration • Milwaukee River Keepers • River Alliance of Wisconsin • Wisconsin Wildlife Federation • Midwest Environmental Advocates
No, Really • It looks like DNR is handing out limits right along NR guidelines • If you’re on a named river, 0.1 mg/L • If you’re on any other receiving stream, 0.075 mg/L • We’re starting to see some movement on getting down to compliance • Looks like economic hardship is a viable solution
Phos Updates • NR217.19-if the resulting cost of implementing the phosphorus WQBEL is greater than 2% of the MHI of the municipality, it would be concluded that the economic impact is adverse enough to warrant granting of the variance • Still may involve rate increases • Variance for forever???
Phos Updates • Economic hardship won’t work by itself • WWTPs will have to do “Something” for phos treatment • Add chemical (or more chemical) • Try to remove sources • Interim phosphorus limits
Trading • Nothing official yet • Cumberland Model is most successful and has been established for a long time • Trading is going to depend on working with… and paying for…agents to work with farmers and farm organizations
Trying to Get Answers • WRWA has been trying to get plain answers so we can start getting out the compliance processes • Ask our DNR friends for who would we talk to to confirm these interpretations of the rule • A final word so to speak