Download
1 / 19
190 likes | 329 Vues
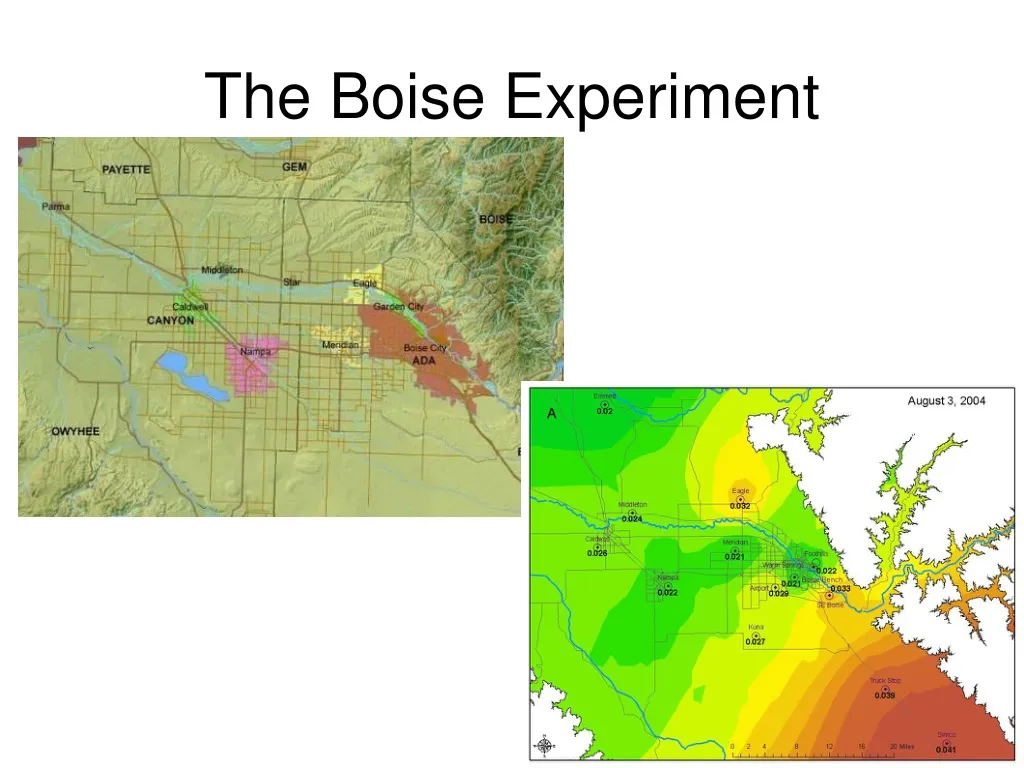
The Boise Experiment. Spatial/temporal variation of ozone. Urban background ~ 33ppbv. Uniform temporal variation. Ozone-VOC-NOx, meteorology and topography. Weekend effect. Ozone inhibition and accumulation Weekday vs. weekend effect Role of precursor reductions.

E N D
Spatial/temporal variation of ozone Urban background ~ 33ppbv Uniform temporal variation
Ozone inhibition and accumulation • Weekday vs. weekend effect • Role of precursor reductions
Lessons Learned from Boise Size (and resources) of field studies may vary (coordinate with modeling efforts) Both local and regional characteristics should be addressed • Local and regional characteristics of ozone sources and impacts • Continental background increased (twice since pre-industrial) • Ozone precursors defines the conditions of photochemistry and provide directions for future efforts • Meteorology and topography defines the spatial and temporal variation • Local sources (and for non-stagnant conditions) are responsible for significant increase of ozone concentrations • Stagnant conditions and regional events/sources add on ozone (and its precursors) concentrations
Monitoring Ozone monitoring network (and its precursors including CO) • A “basic” configuration should include O3, NOx, TVOC, CO FRM monitors or portable monitors (accuracy/precision, resources, stuff) If coupled with IMPROVE particle monitors, data on wildfires and other regional sources of ozone precursors may be obtained. “Bulk” chemistry for models 2. An “advanced” configuration should include NOy, speciated VOCs “Heavier” equipment, can identify the role of terpenes on background ozone Detailed chemistry for models 3. Site (or region)-specific studies
Monitoring Network Design • For regional studies: • important to fill in gaps between urban areas especially in west • Utilize rural ozone sites (e.g. CASTNet) • For local studies: • Put area into regional perspective using rural sites • fill in gaps upwind is important • Instrument possible transport pathways • important to have good hourly data
Upper Air Met Data Collection • Boundary layer structure are key measurements • Vertical profiles of T, RH, winds, O3 • Hourly basis is best although expensive • Can use pseudo-profiles from hills and mountains • Radar wind profiler most useful; data up to 3.7 km; every 30 minutes • SODARs were used in LV study but not that useful given the short range and amount of effort to get reliable data; data up to 600 m • Other aloft data collected with rawinsondes, ozonesondes, pibal (winds), glider (T,O3) and aircraft (T,O3), tethered balloon (T,RH,winds,O3)
Data Analysis and Modeling • Monitoring Data Analysis Modeling • “Traditional” ozone data analysis • Integration of regional meteorology and air mass trajectories • - backward trajectories to determine if “high-ozone” air mass intercepted an area or large point source • - forward trajectories to determine whether or not contaminated plumes (e.g wildfires) are mixed with surface air
Locating Fire Events • During the event: • 209 reports • IR Fire imagery • MODIS, GOES ch2, AVHRR • GOES ABBA • Visible imagery • Look for smoke plumes in GOES • After the event • MODIS products
Locating Smoke • Surface data • ASOS, AirNow • Hazard Mapping System • NOAA product • Visible imagery • GOES (hourly), MODIS (2x day) • Model Results • BlueSky • Navy Aerosol Analysis Prediction System • Aerosol Optical Depth • MODIS, MISR, GOES, AERONET
Field Study Design Observations • Take advantage of opportunities to collect information during episodes • Fires (local, regional, news) • Important to note plume heights • Local emissions (chip sealing, construction, etc.) • Data that is not archived (e.g. satellite, weather data)
Field Study Design Observations • Nail down study objectives early in the design • What are the primary questions to answer? • How is the data going to be used? • List the knowledge and data gaps • Gather parties together in this process to include • Air quality planners, Modelers, Meteorologists, Technicians, Atmospheric chemist • Start siting work early • Local building permitting and inspection take time • You have to know when to bail out of setting up a site and move on
Future Directions • What conditions describe ozone formation (VOC or NOx-limited, spatial/temporal characteristics)? • What is the relative importance of regional (non-urban) sources (mainly wildfires)? • What are the major sources (and emissions) of O3 precursors? How they will change (for different controls) and how much O3 levels will be reduced? • Is there a geographical dependence in background O3 levels in US?
Future Directions • What are the precursors of background O3 and how they will change for the next 10-20 years? • Is there a link between climate change and the change in emissions and concentrations of O3 precursors? • Which strategies within the next 5-10 years could improve O3 levels? • What are the contributions of natural sources to levels of O3 precursors over US, how well they are separated and/or interact from anthropogenic sources. Which changes are anticipated (linked to climate change)?