Download
1 / 3
30 likes | 94 Vues
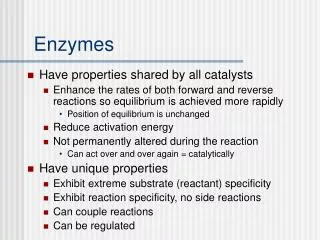
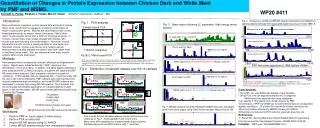
Quantitation of Changes in Protein Expression between Chicken Dark and White Meat by PMF and MSMS. B. MYH peptides. MYH peptides. w. w. w. d1. d1. d1. d2. d2. d2. d1. d1. d3. d3. d3. wd1. wd1. wd1. wd2. wd2. wd2. d1d2. d1d2. d1d2. w. w. wd1d2. wd1d2. wd1d2.

E N D
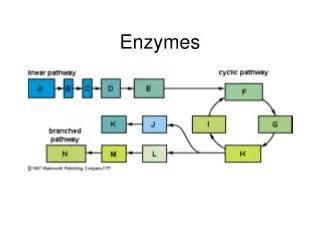
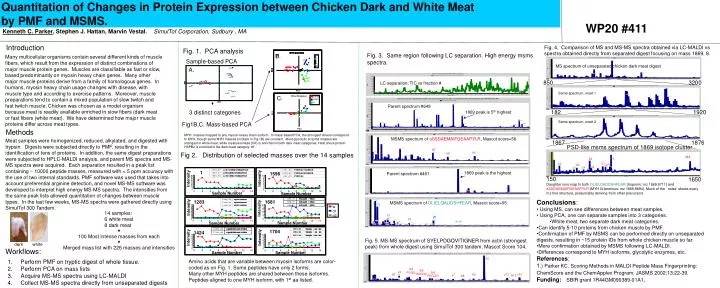
Quantitation of Changes in Protein Expression between Chicken Dark and White Meat by PMF and MSMS. B. MYH peptides MYH peptides w w w d1 d1 d1 d2 d2 d2 d1 d1 d3 d3 d3 wd1 wd1 wd1 wd2 wd2 wd2 d1d2 d1d2 d1d2 w w wd1d2 wd1d2 wd1d2 LC separation; TIC vs fraction # Parent spectrum #649 PC2 1869 peak is 5th highest d2 d2 MS spectrum of unseparated chicken dark meat digest Other Enzymes Other Enzymes Other Enzymes glycolytic glycolytic glycolytic w HSPB2 HSPB2 HSPB2 850 3200 CK CK CK d1 d2 PCA2 PCA2 PCA1 PCA1 PC1 MSMS spectrum of aSSDAEMAIFGEAAPYLR, Mascot score=56 1820 1920 1869 peak is the highest Parent spectrum #461 b4 b6 b5 y14 150 1650 PSD-like msms spectrum of 1869 isotope cluster y6 b6 MSMS spectrum of DLIELQALIDSHFEAR, Mascot score=95 b7 b2 H L b8 1 b5 y6 1596 y4 y3 b4 60 10 Fig. 5. MS-MS spectrum of SYELPDGQVITIGNER from actin (strongest peak) from whole digest using SimulTof 300 tandem. Mascot Score 104. Intensity Intensity 50 14 samples: 6 white meat 8 dark meat 8 40 6 b2 30 y6 y6 4 20 b4 2 10 w,v9 0 0 2 4 6 8 12 2 4 6 8 0 10 14 0 10 12 14 Sample Number Sample Number 1384.74 1384.74 ANLLQAE ANLLQAE V V EELR EELR 1283 1681 100 Most intense masses from each 1398.76 1398.76 ANLLQAE ANLLQAE I I EELR EELR 1386.72 1386.72 ANLLQAE ANLLQAE T T EELR EELR 7 20 Intensity 6 Intensity 15 5 dark white 4 10 Merged mass list with 226 masses and intensities 3 2 5 1 0 0 0 4 6 8 0 6 2 10 12 14 2 4 8 10 12 14 Sample Number Sample Number y10 1373.69 1373.69 VAEQEL VAEQEL L L DA DA T T ER ER 1704 1424 1359.68 1359.68 VAEQEL VAEQEL L L DA DA S S ER ER 14 10 ib4 PDGQ 1377.63 1377.63 VAEQEL VAEQEL M M DA DA S S ER ER Intensity Intensity 12 ib5 PDGQV 8 y3 ib6 PDGQVI 10 6 8 b9 y12 y13 b2 y7 w13 b8 6 4 4 2 2 0 0 2 4 8 0 2 4 6 8 10 0 12 14 6 10 12 14 Sample Number Sample Number WP20 #411 Kenneth C. Parker, Stephen J. Hattan, Marvin Vestal.SimulTof Corporation, Sudbury , MA Fig. 4. Comparison of MS and MS-MS spectra obtained via LC-MALDI vs spectra obtained directly from separated digest focusing on mass 1869. 8. Introduction Fig. 1. PCA analysis Fig. 3. Same region following LC separation. High energy msms spectra. B. MYH peptides MYH peptides Many multicellular organisms contain several different kinds of muscle fibers, which result from the expression of distinct combinations of major muscle protein genes. Muscles are classifiable as fast or slow, based predominantly on myosin heavy chain genes. Many other major muscle proteins derive from a family of homologous genes. In humans, myosin heavy chain usage changes with disease, with muscle type and according to exercise patterns. Moreover, muscle preparations tend to contain a mixed population of slow twitch and fast twitch muscle. Chicken was chosen as a model organism because meat is readily available enriched in slow fibers (dark meat or fast fibers (white meat). We have determined how major muscle proteins differ across meat types. w w w Sample-based PCA d1 d1 d1 d2 d2 d2 d1 d1 d3 d3 d3 wd1 wd1 wd1 wd2 wd2 wd2 d1d2 d1d2 d1d2 w w A. wd1d2 wd1d2 wd1d2 PC2 d2 d2 PC1 Same spectrum, inset 1 C. C. 3 distinct categories PC2 Same spectrum, inset 2 Fig1B,C. Mass-based PCA Methods MYH: masses mapped to any myosin heavy chain isoform. In mass-based PCA, the strongest drivers correspond to MYH, though some MYH masses (in black in Fig.1B) are constant. Most glycolytic enzyme masses are strongest in white meat, while creatine kinase (CK) is enriched in both dark meat categories. Heat shock protein HSPB2 is enriched in the dark meat category ‘d1’. Meat samples were homogenized, reduced, alkylated, and digested with trypsin. Digests were subjected directly to PMF, resulting in the identification of tens of proteins. In addition, the same digest preparations were subjected to HPLC-MALDI analysis, and parent MS spectra and MS-MS spectra were acquired. Each separation resulted in a peak list containing ~ 10000 peptide masses, measured with < 5 ppm accuracy with the use of two internal standards. PMF software was used that takes into account preferential arginine detection, and novel MS-MS software was developed to interpret high energy MS-MS spectra. The intensities from the same peak lists allowed quantitation of changes between muscle types. In the last few weeks, MS-MS spectra were gathered directly using SimulTof 300 Tandem. 1867 1876 Fig 2. Distribution of selected masses over the 14 samples Daughter ions map to both DLIELQALIDSHFEAR (troponin; mz 1869.9711) and aSSDAEMAIFGEAAPYLR (MYH N-terminus; mz 1869.8694). Much of the ‘ noise’ shows every mz fine structure, presumably deriving from other precursors. • Conclusions: • Using MS, can see differences between meat samples. • Using PCA, one can separate samples into 3 categories. • White meat, two separate dark meat categories. • Can identify 5-10 proteins from chicken muscle by PMF. • Confirmation of PMF by MSMS can be performed directly on unseparated digests, resulting in ~15 protein IDs from whole chicken muscle so far. • More confirmation obtained by MSMS following LC-MALDI. • Differences correspond to MYH isoforms, glycolytic enzymes, etc. • References: • 1.) Parker KC. Scoring Methods in MALDI Peptide Mass Fingerprinting: • ChemScore and the ChemApplex Program. JASMS 2002;13:22-39. • Funding:SBIR grant 1R44GM090389-01A1. Workflows: • Perform PMF on tryptic digest of whole tissue. • Perform PCA on mass lists • 3. Acquire MS-MS spectra using LC-MALDI • 4. Collect MS-MS spectra directly from unseparated digests Amino acids that are variable between myosin isoforms are color-coded as on Fig. 1. Some peptides have only 2 forms. Many other MYH peptides are shared between these isoforms. Peptides aligned to one MYH isoform, with 1st aa listed.