Download
1 / 14
140 likes | 472 Vues
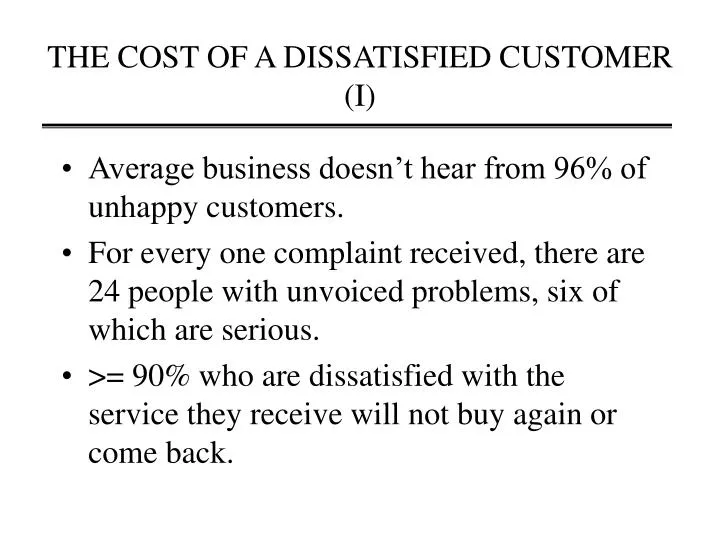
THE COST OF A DISSATISFIED CUSTOMER (I). Average business doesn’t hear from 96% of unhappy customers. For every one complaint received, there are 24 people with unvoiced problems, six of which are serious.

E N D
THE COST OF A DISSATISFIED CUSTOMER (I) • Average business doesn’t hear from 96% of unhappy customers. • For every one complaint received, there are 24 people with unvoiced problems, six of which are serious. • >= 90% who are dissatisfied with the service they receive will not buy again or come back.
THE COST OF A DISSATISFIED CUSTOMER (II) • Of those who complain, 50% - 70% will do business again if complaint is resolved. 95% will return if resolved quickly. • Average customer with a complaint tells 9 to 10 people, 13% tell more than 20 people. • Those who have complained and had resolution tell five people.
Basic or Reactive Sources Customer service Technical support Claims/refunds Sales force reporting Advanced or Proactive Sources Focused questioning of selected customers Observing customers using the product or service Monitoring customer satisfaction Monitoring of broad market trends Fourth Generation ManagementSOURCES OF CUSTOMER INFORMATION
Result: quality improves and costs decline Cost of producing goods or services Cost of producing waste or errors Cost of doing quality improvement Total costs + + = SAVE HERE SPEND HERE
CUMULATIVE • MATERIAL • SCRAP • EXCESS INVENTORY • INSPECTION EQUIPMENT • TEST EQUIPMENT • POOR MACHINE UTILIZATION • ENERGY • LOST OR MISPLACED MATERIAL • OVER AND UNDER SPECIFICATIONS • EXCESSIVE EQUIPMENT • PEOPLE’S TIME • REWORK • INSPECTION • CHECKING • CLARIFYING • PRODUCING WASTE OR POOR QUALITY • INEFFICIENT MEETINGS • LOST SALES • POOR QUALITY PRODUCTS/SERVICES • NOT RESPONSIVE TO CUSTOMERS NEEDS • POOR CUSTOMER SERVICE • POOR ENGINEERING • CAPITAL • INVESTMENTS • WARRANTY COST • LIABILTIY COST • IDLE EQUIPMENT • DEPRECIATION $ Reduce Chronic Waste
Quality & Productivity: Cost savings Increased productivity Lower processing costs Improved reliability or conformance Lower rework & scrap cost Lower service costs Lower warranty & liability costs Increased financial performance!
Quality & Productivity: Market gains Increased market share Improved performance features, reliability, etc. Improved reputation for quality Experience-based scale economics Higher prices Increased financial performance!
Millions of dollars TQM savings Year Figure 8. Return on TQL investment at Naval Air Warfare Center Aircraft Division, Lakehurst, New Jersey.
60 50 40 Millions of dollars 30 20 10 0 Total savings Employee share 1987 1988 1989 1990 1991 1992 1993 Fiscal year Figure 7. Savings associated with productivity gain sharing at the Naval Aviation Depot, Cherry Point, North Carolina.
Delight Delighters More Is Better Customer Satisfaction Neutral Must Be Dissatisfaction Absent Fulfilled Presence of the Characteristic KANO’S MODEL OF CUSTOMER PERCEPTIONS
A manager who fails to provide resources and time for prevention activities is practicing false economy Concentrate on Prevention, Not Correction PREVENTION CORRECTION QUALITY PREVENTION HAS MORE LEVERAGE WHEN IMPROVING QUALITY
The Trade-off Curve Between the Cost of Inspection and the Cost Due to Producing Defective Units Total cost Inspection and control costs Cost ($) Cost due to defective units Optimal inspection level Quality control activity level
Goal posts defined by supplier A lot Loss Experienced by Customer Little Target (Defined by Customer) TAGUCHI LOSS FUNCTION
High loss Loss (to producing organization, customer and society Unacceptable Poor Good Low loss Best Frequency Target Lower specification Upper specification (a) Quality Loss Function; (b) Distribution of Product Produced. Taguchi aims for the target, because products produced near the upper and lower acceptable specifications result in higher quality loss function. Quality Loss Function (a) Fair Target oriented quality Conformance oriented quality Distribution of Products Produced (b)