Download
1 / 19
210 likes | 355 Vues
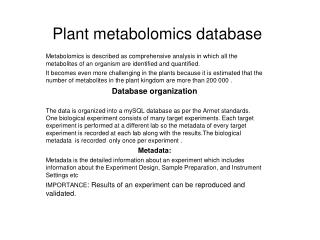
Metabolomics. Bob Ward German Lab Food Science and Technology. Genome- ….All the DNA Transcriptome- ….All the mRNA Proteome- ….All the proteins Metabalome ….All the metabolites. “ ”.

E N D
Metabolomics Bob Ward German Lab Food Science and Technology
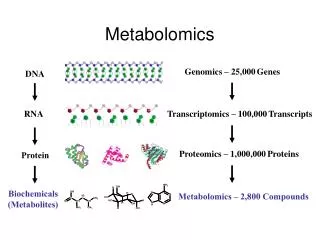
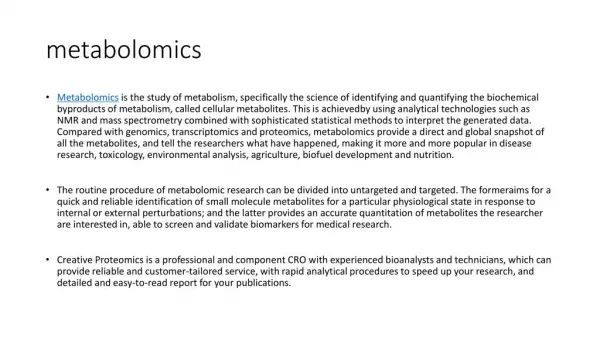
Genome- ….All the DNA Transcriptome- ….All the mRNA Proteome- ….All the proteins Metabalome ….All the metabolites “ ” “Metabolomics is a post genomic technology which seeks to provide a comprehensive profile to all the metabolites present in a biological sample.” (Taylor et. al, 2002)
Limitations of “ohmics” technologies • Genomics • Static picture Expensive Not for individuals • Transcriptomics • Need Genome (annotations) Correlated with proteome? Sampling issues splicing No info on modifications • Proteomics • Technologically challenging Need genome?
Metabolome • Same metabolites for all organisms • ~1k for organism vs 10k(genes) or 100k(proteins) • Technology exists and is not too expensive • Carbohydrate and Lipid info
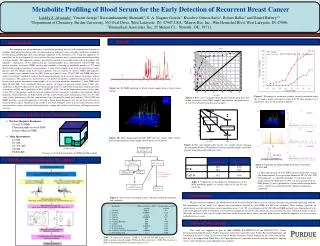
Goal: Discrimination between related genotypes of Arabidopsis • between Co10 and C24 (parent strains) • between Co10 x C24 and progeny (F1) • between (Co10 x C24) and (C24 x Co10) -Maternal line donates both mitochondria and chloroplast -Clear-cut realization of effectiveness -Potential to uncover biologically relevant info
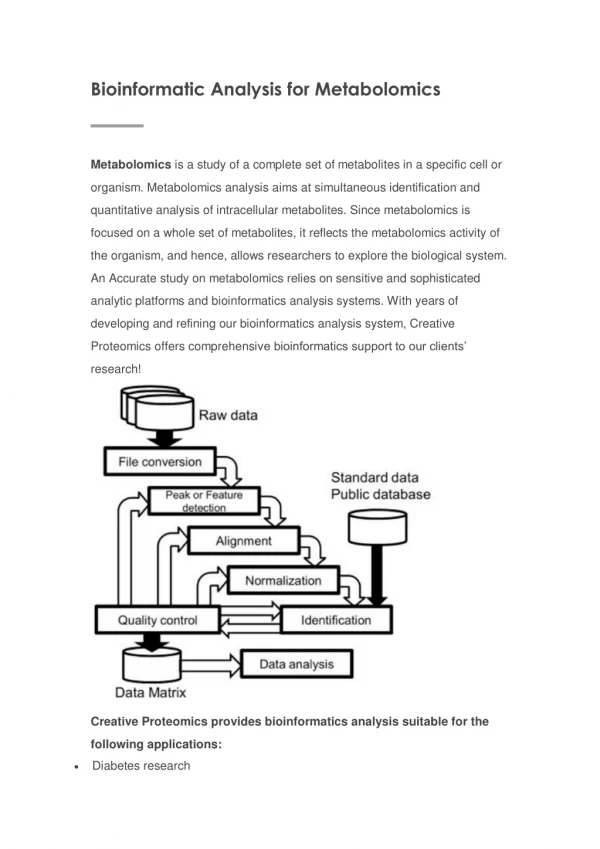
Instrumental and Informatic Tools • GC/MS-Separation/identification of polar metabolites in 1200 second run time • AMDIS deconvoluting software • MassLab to choose target ions • R for statistics • WEKA (standard neural network approach) • Euclidean distance • Principal Component Analysis
Data Work-Up • Selection of reference chromatogram (F1) • 8 individual samples for each genotype • no replicates • Selection of target peaks/analytes (433) • normalized (mg analyte/wt sample)to internal standard (ribitol) • Allows for simple 2-D matrix
201 metabolites identified in some detail (92 as molecular type and 109 by chemical property) High variance in low numbers corresponds to core metabolites
Co10 1-8 C24 9-16 Co10 x C24 17-24 C24 x Co10 25-32
Neural Network Analysis }P=0.27 Lack of samples precluded use of a training subset ‘Leave one out cross’ used for training Model judged by ability to classify remaining object (repeated for all objects) Allows for maximal use of data for validation when n is low
Clustering by Euclidean distance Co10 1-8 C24 9-16 Co10 x C24 17-24 C24 x Co10 25-32
Principal Component Analysis • Used to tease out role of individual metabolites in discrimination • Unsupervised multivariate analysis applied to functions of many attributes • Transformation of large set of related values to smaller set of uncorrelated variables • Attempts to express maximum variance in data • PC’s are axes in multidimensional space • Object characterized by distance to axis
Variance of data explained by first few principal components PCA algorithm from MatLab 78% of variation of data from first 3 PC’s
Principal Component Analysis Co10 and C24 differentiated except outlier F1 genotypes cluster together
Contribution of each variable to first PC Malate and Citrate- metabolites of TCA cycle
Relative peak area for metabolites malate and citrate Co10 contains outlier…..may explain misclassification
Other significant results • Parental genotype removed from PCA analysis and F1’s discriminated by glucose and fructose • Inference that the first PC differentiates parental line, and 2nd and 3rd differentiate F1 • Malate and Citrate from TCA, glucose and fructose from chloroplasts
Conclusions • Advances in technology will improve detection limits and will allow characterization of metabolites • Formalized ontology needed to link chemical structure with pathways • Metabolite profiling is an exciting new field which complements other non-hypothesis driven global analysis technologies • Large amounts of informatic support to develop field and to correlate data from genomics, microarrays, and proteomics