Download

1 / 22
600 likes | 1.45k Vues
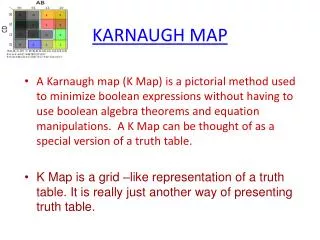
Introduction to the Karnaugh Map. Alan Clements. Karnaugh Maps The Karnaugh map , or K-map , is a graphical technique for the representation and simplification of a Boolean expression.

E N D
Introduction to the Karnaugh Map Alan Clements
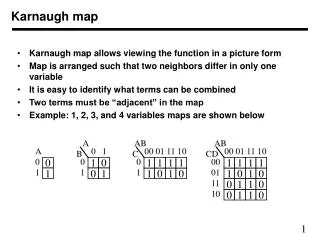
Karnaugh Maps The Karnaugh map, or K-map, is a graphical technique for the representation and simplification of a Boolean expression. The K-map is a two-dimensional form of the truth table, drawn in such a way that the simplification of a Boolean expression can be seen from the location of 1s on the map. A system with n variables has 2n lines in its truth table and 2n squares on its K-map. Each square on the K-map is associated with a line (i.e., minterm) in the truth table. Figure 1 shows a K-map for three variables. The key to the Karnaugh map is the layout of the squares. Horizontally and vertically adjacent squares differ by only one variable. For example, in Figure 1 the leftmost two terms on the top line are ABC and ABC. The only difference between these terms is B and B. Figure 1 K-map for three variables
Figure 2 shows a K-map for four Variables where all the 16 minterms of a truth table appear. It is easy to read a K-map. In Figure 2, the square with ABCD in it represents the minterm ABCD and falls in the AB column 01 and the CD row 11. Figure 2 K-map for four variables
Figure 3 shows how a K-map can be interpreted in terms of the regions over which a variable is true or false. Here, the region on dark blue shows the region for which A, B, C, and D are true, respectively. The region in light blue corresponds to the region where a variable is false. Figure 3 The regions of a K-map
Figure 4 shows how we read a 4-variable K-map. On the right-hand side we have a K-map with four minterms. These correspond to ABCD, ABCD, ABCD, and ABCD. Figure 4 Reading a K-map
A three-variable K-map has four vertical columns, one for each of the four possible values of two out of the three variables. The leftmost column is labeled 00 and represents the region for which A = 0, B = 0. The next column is labeled 01, and represents the region for which A = 0, B = 1. The next column is labeled 11 and represents the region for which A = 1, B = 1. The fourth column, 10, represents the region for which A = 1, B = 0. Figure 5 Plotting minterms on a K-map
The three-variable K-map below has two horizontal rows, the upper row corresponding to C = 0 and the lower to C = 1. Any square on this K-map represents a unique combination of the three variables in true or complemented form. The figure demonstrates how F = ABC + ABC +ABC is plotted. A square containing a logical 1 is said to be covered by a 1. No two 1s plotted on the K-map are adjacent to each other, and that the function F = ABC + ABC + ABC cannot be simplified. Squares that do not contain a 1 are left unmarked even though they must contain a 0. . Figure 5 Plotting minterms on a K-map
Consider figure 6 in which the function f1 = ABC + ABC is plotted on the left-hand map. The two minterms in this function are ABC and ABC and occupy the cells for which A = 1, B = 1, C = 0, and A = 1, B = 1, C = 1, respectively. Figure 6 Plotting two Boolean expressions on a K-map
In the K-map for F1 two adjacent squares are covered. Now look at the map for F2 = AB. A group of two squares is covered, corresponding to the column A = 1, B = 1. F2does not involve C, and a 1 is entered in the squares for which A = B = 1 and C = 0, and A = B = 1 and C = 1; i.e., a 1 is entered for all values of C for which AB = 11. When plotting a product term like AB, you locate the region for which AB = 11. The two K-maps are identical, so that F1 = F2 and ABC + ABC = AB. Using Boolean algebra, ABC + ABC = AB(C + C) = AB(1) = AB. Two adjacent squares in a K-map can be grouped together to form a single simpler term. Figure 6 Plotting two Boolean expressions on a K-map
Simplifying Sum-of-Product Expressions with a Karnaugh Map The first step in simplifying a Boolean expression by means of a K-map is to plot all the ones in the function's truth table on the K-map. The next step is to combine adjacent 1s into groups of one, two, four, eight, or sixteen. The groups of minterms should be as large as possible—a single group of four minterms yields a simpler expression than two groups of two minterms. The final stage in simplifying an expression is reached when each of the groups of minterms (i.e., the product terms) are ORed together to form the simplified sum-of-products expression. We now have to demonstrate how the product terms of a general Boolean expression are plotted on the map. Figures 7 to 12 presents six functions plotted on K-maps. In these diagrams various sum-of-products expressions have been plotted directly from the equations themselves, rather than from the minterms of the truth table. The following notes should help in understanding these diagrams.
The following notes should help in understanding these diagrams. • 1. For a four-variable K-map: • 1-variable product term covers 8 squares • 2-variable product terms cover 4 squares • 3-variable product terms cover 2 squares • 4-variable product terms cover 1 squares • A square covered by a 1 may belong to more than one term in the sum-of-products expression. • If a 1 on the K-map appears in two groups, it is equivalent to adding the corresponding minterm to the overall expression for the function plotted on the map twice. • Repeating a term in an expression does not alter the value of the expression, because one of the axioms of Boolean algebra is X + X = X.
The K-map is not a square or a rectangle as it appears in these diagrams. A K-map is a torus or doughnut shape. • That is, the top edge is adjacent to the bottom edge and, the left-hand edge is adjacent to the right-hand edge. • Whenever a group of terms extends across the edge of a K-map, we have shaded it to emphasize the wrap-around nature of the map. • In order either to read a product term from the map, or to plot a product term on the map, it is necessary to ask the question, what minterms (squares) are covered.
Example 1 Figure 13 gives a K-map for the expression F = AB + ABCD + ABCD + ABCD. The simplified function is F = AB + BD + ACD.
Example 2Figure 14 gives a K-map for the expression F = ACD + ACD + ABC + ABD. In this case only one regrouping is possible. The simplified function is F = BD + ACD + ACD + ABC.
Example 3Figure 15 gives a K-map for the expression F = ABCD + ABCD + ABCD + ABCD + ABCD + ABCD + ABCD + ABCD This can be simplified to two product terms with F = BD + BD.
Example 4Figure 16 gives a K-map for the expression F = ABC + ABC + ABC + ABC + ABC We can group the minterms together in two ways, both of which are equally valid; that is, there are two equally correct simplifications of this expression. We can write either F = AB + AC + AB or F = AB + BC + AB.