Download
1 / 31
320 likes | 473 Vues
Policy In an LOE. MP & FP in a Large Open Economy Think of US (LOE) vs. Ireland (SOE) If we think of the purpose of policy is to control Y then we get The reason is the automatic effects of BP For LOE the results not so stark as for SOE. Fiscal Policy Fixed e.

E N D
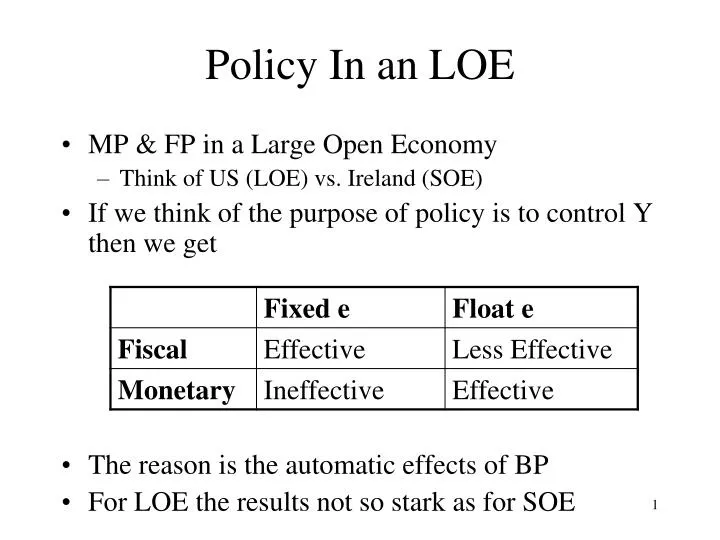
Policy In an LOE • MP & FP in a Large Open Economy • Think of US (LOE) vs. Ireland (SOE) • If we think of the purpose of policy is to control Y then we get • The reason is the automatic effects of BP • For LOE the results not so stark as for SOE
Fiscal Policy Fixed e • G up: IS shifts to right (why?) • Internal balance at B • BP>0(why?) • Under fixed e this leads to expansion of the money supply • LM shifts down • Interest rate falls • Balance restored at C • Basically the same as SOE but… • Interest rates increases • Output increases, but by less than in SOE (why?)
Fiscal policy: Fixed e r B BP C A LM0 IS1 LM1 IS0 Y
Monetary Policy & Fixed e • Expand money supply: purchase bonds • LM shifts down • Internal balance at B • BP<0 • Net currency out flow • Money supply falls back • Return to A • MP is ineffective • Only change is in central banks balance sheet • Same as SOE
Monetary Policy: Fixed e r BP A B LM0 LM1 IS0 Y
Fiscal Policy with Floating e • G up: IS shifts to right (IS0IS1) • Internal balance at B • BP>0 • excess supply of $ and/or excess demand for € • Under float e this leads to an appreciation of € • Exports fall • IS curve shifts left (IS1IS2) • For LOE there is additional effect • The appreciation causes the BP=0 curve to shift up • NX fall so higher r necessary and world interest rates are affected because LOE • This meets the IS curve coming back from B to give a new eqm at C • Note contrast with other regimes • fiscal policy has an effect on output • Smaller than closed economy or fixed e rate • Larger than float e rate with SOE (which was zero) • Interest rates rise
Fiscal policy: float e, LOE IS2 r BP1 B C BP0 A LM0 IS1 IS0 Y
Monetary Policy with Float e • Expand the Money supply • LM shifts down • Internal balance at B • BP<0 • net outflow of funds • Excess demand for $ (or supply of €) • Price of € falls: e falls depreciation in the € • Net exports rise • IS curve shifts to the right • For LOE there is an additional effect • The depreciation causes the BP=0 curve to shift down • NX rise so need lower r to balance • This meets the IS curve coming back from B to give a new eqm at C • Note contrast with other regimes • monetary policy has an effect on output • Larger than closed economy or fixed e rate • Could be smaller or larger than float e rate with SOE • Interest rates may rise or fall
Monetary policy: Float e r BP0 BP1 A C B LM0 IS1 IS0 LM1 Y
Summary of Policy • Policy effectiveness depends on three things • SOE or LOE: can we affect the world interest rate • Exchange rate regime: Fixed or Float • MP or FP • The reason for the complication is the automatic effects of BP • This gives 16 possible scenarios, don’t try to learn them off
Apply the Model • The Asian Crisis 1997 • Currency crisis that affects almost every east Asian country from July 1997 • Follows the general pattern of currency cries (see over) but • Huge devaluations • Added problems with banking systems • Allegations of market over-reaction
General Structure of Currency Crises • Country in a recession with fixed e rate • Markets expect that gov will try to boost economy • Monetary Policy: require floating exchange rate and depreciating exchange rate • See previous section • Owners of domestic currency try to get out • Fiscal policy • Work under fixed e • but government may not be able to borrow • Crises usually happen in debt-ridden countries
Monetary Policy with Float e • Expand the Money supply • LM shifts down • Internal balance at B • BP<0, r<r* • net outflow of funds • Excess demand for $ (or supply of €) • Price of € falls: e falls depreciationin the € • Net exports rise • IS curve shifts to the right • Overall Balance at C • Note contrast with closed economy and fixed e • No change in r • Larger change in Y • Net exports are “crowded in”
Monetary policy: Float e, SOE r BP A C B LM0 IS1 IS0 LM1 Y
Risk • Expectation of devaluation leads to higher interest rates • Interest rates affected by risk • Worried we get paid back in lower vlaue currency • SOE r=r* normally • But if there is a risk then r=r*+p • Where p is “risk premium” • Extra premium if risk of bank failure
Risk and BP • As we will see this makes recession worse • The premium is like an increase in world interest rates • Shift BP up • BP <0 (see “Imbalance” section) • net outflow of (foreign) currency • Money supply falls • LM curve shifts up • Interest rate rises to stem the outflow of funds • New eqm at B: output is lower • Note Change in money supply is automatic – not policy • Mechanism: CB buys € with $ from reserves
r LM2 B LM1 BP2 r*+p A r* BP1 IS1 Y
Recession & Risk • This effect of risk is exactly what you don’t want when you face a recession anyway. • Supposing there is a pre-existing recession anyway • IS curve shifts left (why?) • One way to get out of recession is to dump fixed e and expand money supply • So risk premium rises • Makes recession worse • Makes monetary expansion more attractive • Vicious circle
A Crisis Evolves… • Diagram gets complicated but its just the confluence of the two effects • A recessionary shock • IS1IS2 AB • BP<0 • LM shift up: BC • But if risk premium increases at the same time • BP1BP2 • Still in BP<0 at C • LM shifts up again • New equilibrium at D – nasty recession • Process may repeat
LM3 r LM2 LM1 D BP2 r*+p A r* BP1 C B IS1 IS2 Y
Examples of Crises • 2010: Ireland • Initial shock: housing bubble • Risk premium: rise quickly fear of default • 2010: Greece • Initial shock: public debt lies • Risk premium: rise quickly fear of default & devaluation • 1992: UK • Recession followed by rise in interest rates • Risk premium: fear of devaluation
1997 Asian Crisis • Recession? • Asian tigers phenomenal growth • Kor Thai HK • Underlying real problems • Bubble • Banks • Bursting of bubble leads to recession • Expectation of a devaluation • Speculators move
Summary of Pre-existing Factors • Construction boom financed by foreign borrowing • Bubble in Real Estate • GDP boom: apparent not real • Inflation & lost competitiveness • Financed by $ borrowing • Lower interest rates < apparent return to property • Short term via the banking system • One big hedge fund: $ liabilities, domestic assets • Sounds familiar? • Reasons not to trust the governments? • Investors unfamiliar with economies rush to judgement • Clear examples of corruption
Catalyst • What starts the crisis? • For Asia it was US int rate rise • Fixed e implies Asian interest rates rise • BP curve shifts up • Recession (why?) • Exchange rate under immediate pressure • CB can maintain e rate with reserves • Begin to run low on reserves
Role of Bubble • Bubble would eventually burst with or without crisis • Some debate as to whether already started to burst in Thailand before crisis • Bursting of bubble will reduce GDP • Construction sector falls • IS shifts left • Recession
Self-reinforcing • Investors expect a devaluation • MP under floating e could rescue economy • Risk premium rises • Leads to higher interest rates • BP shifts up • Recession worse under fixed e • Self-fulfilling prophecy • This is the standard speculative story
Role of Contagion • Crisis spread from one country to another • Fundamental problems were less true of later countries – but they still had a crisis • Contagion is “psychological” • Investors make judgement about one invest based on performance of another • Not always rationale • Lump “emerging markets” together • So Thailand’s problem increase likelihood of bad investment • Racist?
Countries • Thailand: • 1986-96: growth of 9% (not a recession!) • Inflation of 2-6%: loss in competitiveness • Devalued by 50% • Indonesia: • Devalued by 80% • GDP declined by 13% • Suharto over-thrown • Korea • Less real problems • Depreciated by 50% • Numerous bankruptcies • Quick bounce back
Hong Kong • Defeated speculators – did not devalue • Strongest economy in region • Strongest legal framework • “almost one of us” • Real issue: inflation implying loss in competitiveness • Contagion gone too far • HK played dirty
Conclusions • BOP equilibrium is given by BP curve • Y up BP<0r up cap inflows BP=0 • IS-LM-BP give overall equilibrium • Adjustment mechanism depends on exchange rate regime • Effectiveness of FP and MP depends on exchange rate regime • MP with floating e, FP with fixed e • Effectiveness of FP and MP depends on the SOE\LOE assumption • Apply it to some real world cases • Explains currency crises
What’s Missing? • Expectations or forward looking behaviour • No price adjustment • Very simplistic approach to supply side