Download
1 / 3
30 likes | 108 Vues
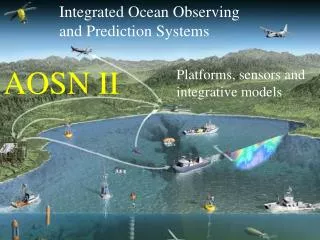
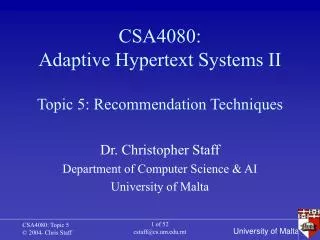
Atmospheric Forecasts Adaptive Ocean Sampling Network II (AOSN-II) Monterey Bay Predictive Skill Experiment. 3 km. 9 km. 27 km. 81 km. Real-Time AOSN COAMPS NRL MRY ran a 4-nest grid structure w/3 km grid spacing for real-time support of AOSN.

E N D
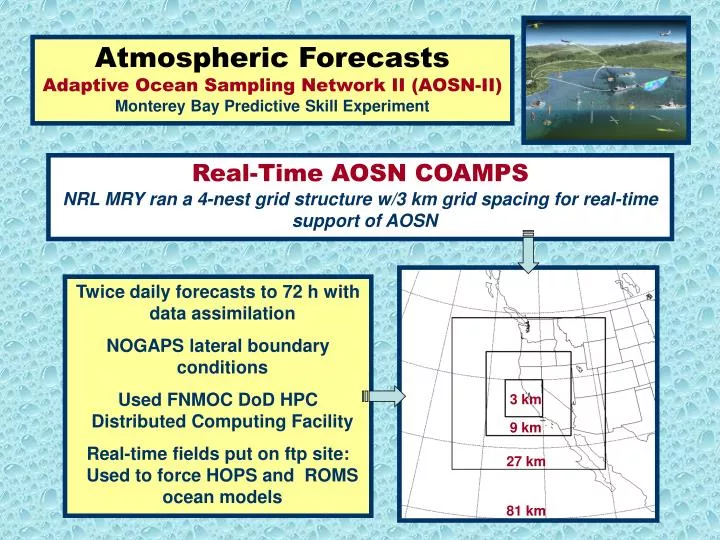
Atmospheric Forecasts Adaptive Ocean Sampling Network II (AOSN-II) Monterey Bay Predictive Skill Experiment 3 km 9 km 27 km 81 km Real-Time AOSN COAMPS NRL MRY ran a 4-nest grid structure w/3 km grid spacing for real-time support of AOSN Twice daily forecasts to 72 h with data assimilation NOGAPS lateral boundary conditions Used FNMOC DoD HPC Distributed Computing Facility Real-time fields put on ftp site: Used to force HOPS and ROMS ocean models
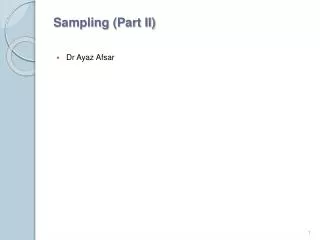
COAMPS 3 km Forecast Surface Stress Compares Favorably to Observed Stress at M1 Buoy M1 Observations August 2003 COAMPS Forecast 27 km The leftmost 3 boxes show COAMPS wind speed (color) and direction (arrows) for 27, 9, and 3 km grids 9 km M1 Representation of Coastal Jets, Wind Stress Curl, and Coastal Shear Zone Improved using Higher Resolution Grid Ocean modelers have shown improved representation of the wind stress curl using the 3 km grid at the coast leads to improved representation of upwelling1 August 2003 3 km 0 2 4 6 8 10 12 Wind Speed (m/s) Atmospheric Forecasts Adaptive Ocean Sampling Network II (AOSN-II) Horizontal Resolution Sensitivity/Wind Stress Validation Graphs on right show observed (upper) and COAMPS (lower) Surface Stress
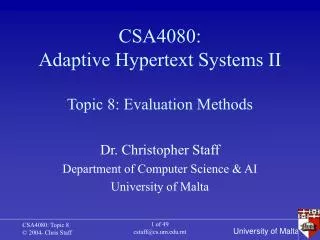
Results indicate that COAMPS is able to replicate daily diurnal changes in wind speed as well as larger time scale synoptic events Observed Wind Speeds (blue) 0-12h COAMPS Wind Speeds (red) For M1 (top) and M2 (bottom) 15 M1 10 Wind Speed (m/s) 5 0 7/27/03 8/3/03 8/10/03 8/17/03 M2 12 8 Santa Cruz MRY Wind Speed (m/s) M1 4 M2 0 7/27/03 8/3/03 8/10/03 8/17/03 Atmospheric Forecasts Adaptive Ocean Sampling Network II (AOSN-II) Evaluation of COAMPS Winds Courtesy of Oleg Logoutov and Pierre Lermusiaux, Harvard University