Download
1 / 20
200 likes | 251 Vues
Participation Forecast. May 9, 2006. Participation Forecast. Designed to be conservative Based on five years of historical enrollment by age, race/ethnicity, and county Uses latest available population projections by age, race/ethnicity, and county

E N D
Participation Forecast May 9, 2006 THECB 5/2006
Participation Forecast • Designed to be conservative • Based on five years of historical enrollment by age, race/ethnicity, and county • Uses latest available population projections by age, race/ethnicity, and county • Considers non-resident participation factors • Solicit institutional input on local conditions THECB 5/2006
Public Higher Education Participation THECB 5/2006
Caveats • Forecast is based on historical in-state participation patterns by county. If institutions recruit students from different areas, rates will change • The economy affects participation. It usually expands during times of increasing unemployment. THECB 5/2006
Timing Issues THECB 5/2006
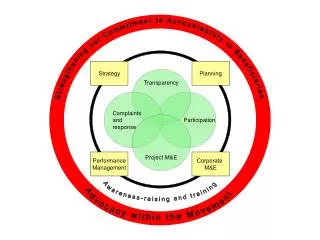
Historical ratio between in-state and non-resident enrollment by institution Institutions’ 5 prior years’ historical enrollment by county/age/ ethnicity Current preliminary in-state enrollment by institution Adjustment for institutions’ policies and local conditions Compare 3-forecasts with current preliminary and select “best fit” rate for each institution Draft total enrollment forecast by institution 3-in-state enrollment rates by institution/ county/age/ ethnicity 3-in-state forecasts for current yr for each institution Enrollment Forecast Texas pop. By county/age/ethnicity Use “best fit” rate & pop to forecast prior, current, next 2 yrs, + 5 & + 10 yrs in-state enrollment by institution Adjust in-state Forecast by Institution for prior, current, next 2 yrs, +5 and +10 yrs 5 prior yrs current yr next 2 yrs, + 5 yrs, +10 yrs Enrollment Forecast Development Process THECB 5/2006
Three Alternatives Participation Rates • Percentage county/age/racial enrollment rate for prior year • Two regression racial/ethnic rate • Each rate has attendance rates for 254 counties by institution by six age groups (15-19, 20-24, 25-29, 30-34, 35-39, 40+) and four racial/ethnic groups (White, African-American, Hispanic, Other) THECB 5/2006
In-State Participation by Age and Race/Ethnicity-Universities THECB 5/2006
Percentage Rate • Total number of students in each age and racial/ethnic group from each county attending each institution • Divided by total population by age and racial/ethnic group in county • Gives each county’s age and race/ ethnicity attendance rate per institution THECB 5/2006
Regression Racial/Ethnic Rates • Used to develop two straight line arithmetic trend participation rates • The previous five-year trend line extended to the following year • The previous five-year trend line extended to two years hence THECB 5/2006
Yc= a + bx • Yc = predicted trend participation for each age and racial/ethnic group divided by the total population on specific age and racial/ethnic in the county by year • a = mean participation over the five-year period • b = deviation from center year multiplied by observed participation, summed and divided by sum of squares of deviations THECB 5/2006
Yc= a + bx • x = +2 for five year trend extended to the following year • x = +3 for five year trend extended to the year after that THECB 5/2006
Application of Rates • All three rate applications are used to produce current year’s forecast • “Best fit” rate becomes selected in-state participation rate • Selected rate must be closest to historical participation pattern: • if pattern is increasing, selection should be greater than preliminary current year’s participation • If pattern is stable, select nearest alternative THECB 5/2006
Comparison with Current Year’s Actual/Preliminary Enrollment • If historical enrollment increasing or decreasing, rate chosen must be within 3% of the preliminary/actual current year enrollment • If historical enrollment is stable, alternative must be within 1% of the preliminary/ actual current year enrollment • Produce estimates for next 2 years and 5 and 10 year estimates THECB 5/2006
Nonresident Participation Rates • 5 years of historical data used to determine “nonresidential percentage factor” • Current year’s estimate compared with preliminary/actual enrollment • Percentage applied to estimated enrollments THECB 5/2006
Adjustments • Knowledge of local issues and changes considered when reviewing projections • Projected enrollments at capped institutions are redistributed to others • Draft sent to institutions for comment and potential alteration THECB 5/2006
2002 and 2004 Forecasts for 2005 and Actual THECB 5/2006
FAQs • Economic issues and unemployment: can’t get regional forecasts variations. • Asians not included as separate racial/ethnic group because of small numbers in many counties. • Yes, even if only one person from a county a rate is developed. • Institutions with substantial nonresidents (e.g., those on border) harder to forecast. THECB 5/2006
Conclusions • Forecast is better statewide than per institution. • Multiplier and institutional adjustments are fudge factors for influences that are harder to quantify. • State’s goal is for more students than forecasts predict. Hope forecast is wrong. THECB 5/2006
Texas public higher education enrollment growth is not forecast to achieve target 604,000 335,000 118,460 Source: Texas Higher Education Coordinating Board THECB 5/2006